创建带标记的线图
在线图中添加标记是区分多个线条或突出显示特定数据点的有用方法。使用下面的一种方式添加标记:
在线条设定输入参量(例如
plot(x,y,'-s'))中包含标记符号。将
Marker属性指定为一个名称-值对组,例如plot(x,y,'Marker','s')。
有关标记选项列表,请参阅支持的标记符号。
在线图中添加标记
创建一个线图。通过在调用 plot 函数时包含线条设定输入参量,在每个数据点处显示一个标记。例如,使用 '-o' 可得到一条带圆形标记的实线。
x = linspace(0,10,100);
y = exp(x/10).*sin(4*x);
plot(x,y,'-o')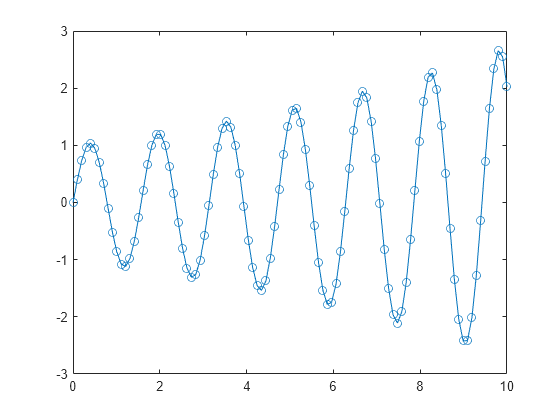
如果指定了标记符号但未指定线型,则 plot 仅显示无线条连接的标记。
plot(x,y,'o')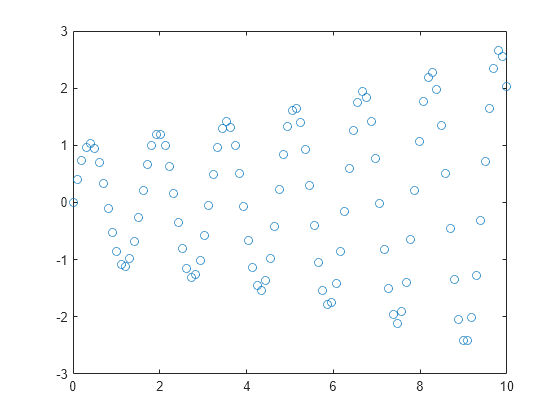
也可以通过将 Marker 属性设置为名称-值对组,在线条中添加标记。例如,plot(x,y,'Marker','o') 将绘制一个带圆形标记的线条。
指定标记大小和颜色
创建带标记的线图。通过结合使用 plot 函数和名称-值对组参量来设置这些属性,即可自定义标记:
MarkerSize- 标记大小,指定为正值。MarkerEdgeColor- 标记轮廓颜色,指定为颜色名称或 RGB 三元组。MarkerFaceColor- 标记内部颜色,指定为颜色名称或 RGB 三元组。
使用颜色名称的字符向量(例如 'red')或 RGB 三元组(例如 [0.4 0.6 0.7])指定颜色。RGB 三元组是包含三个元素的行向量,其元素分别指定颜色中红、绿、蓝分量的强度。强度必须处于范围 [0,1] 中。
x = linspace(0,10,50);
y = sin(x);
plot(x,y,'-s','MarkerSize',10,...
    'MarkerEdgeColor','red',...
    'MarkerFaceColor',[1 .6 .6])

控制沿线条的标记放置
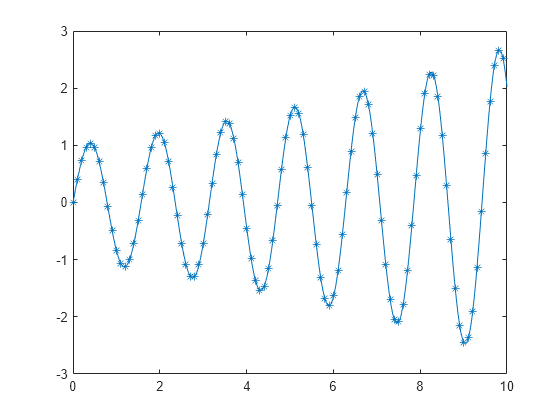
创建包含 1000 个数据点的线图,添加星号标记,并使用 MarkerIndices 属性控制标记位置。将此属性设置为要显示标记的数据点的索引。从第一个数据点开始,每隔十个数据点显示一个标记。
x = linspace(0,10,1000);
y = exp(x/10).*sin(4*x);
plot(x,y,'-*','MarkerIndices',1:10:length(y))
在最大数据点和最小数据点处显示标记
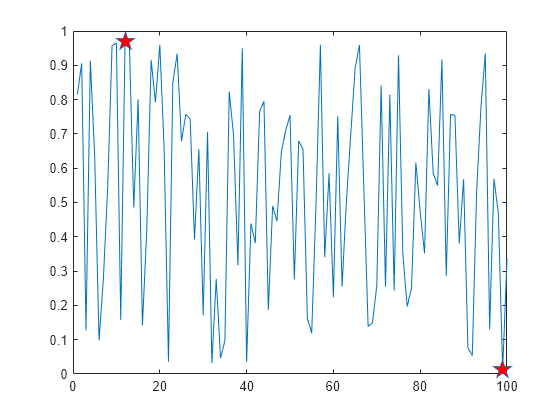
创建一个随机数据向量,并查找最小值和最大值的索引。然后创建数据的线图。通过将 MarkerIndices 属性设置为索引值向量,在最小数据值和最大数据值处显示红色标记。
x = 1:100;
y = rand(100,1);
idxmin = find(y == max(y));
idxmax = find(y == min(y));
plot(x,y,'-p','MarkerIndices',[idxmin idxmax],...
    'MarkerFaceColor','red',...
    'MarkerSize',15)
恢复为默认标记位置
修改标记位置,然后恢复为默认位置。
创建一个线图,并每隔五个数据点显示大的方形标记。将图形线条对象赋给变量 p,以便在创建后访问其属性。
x = linspace(0,10,25);
y = x.^2;
p = plot(x,y,'-s');
p.MarkerSize = 10;
p.MarkerIndices = 1:5:length(y);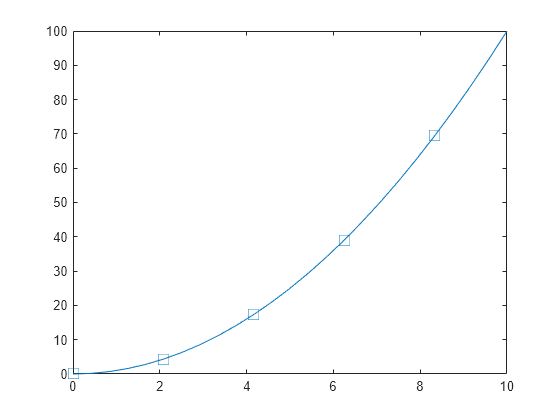
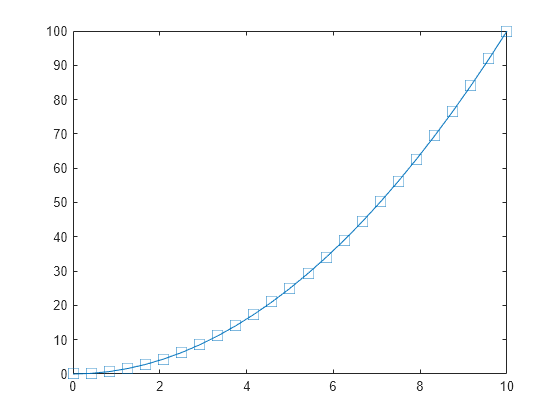
将 MarkerIndices 属性重置为默认值,即从 1 到数据点数量之间的所有索引值组成的一个向量。
p.MarkerIndices = 1:length(y);
支持的标记符号
| 标记 | 描述 | 生成的标记 |
|---|---|---|
"o" | 圆圈 |
|
"+" | 加号 |
|
"*" | 星号 |
|
"." | 点 |
|
"x" | 叉号 |
|
"_" | 水平线条 |
|
"|" | 垂直线条 |
|
"square" | 方形 |
|
"diamond" | 菱形 |
|
"^" | 上三角 |
|
"v" | 下三角 |
|
">" | 右三角 |
|
"<" | 左三角 |
|
"pentagram" | 五角形 |
|
"hexagram" | 六角形 |
|
"none" | 无标记 | 不适用 |


线条设定输入参量不支持有多个字符的标记选项。请改用一个字符的选项或设置 Marker 属性。