优化求解器绘制函数
什么是绘图函数?
options 结构体的 PlotFcns 字段指定优化函数在每次迭代时调用的一个或多个函数,用于绘制各种进度测度。传递函数句柄或函数句柄的元胞数组。
PlotFcns 选项可以与下列 MATLAB 优化函数配合使用:
fminbndfminsearchfzero
这些优化函数的预定义绘图函数包括:
@optimplotx绘制当前点@optimplotfval绘制函数值@optimplotfunccount绘制函数计数(不适用于fzero)
示例:使用内置绘图函数
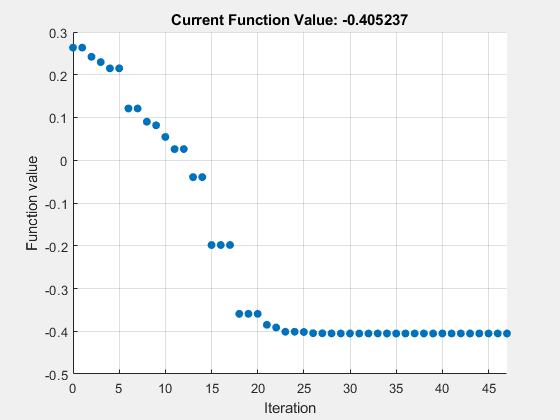
查看使用 fminsearch 与绘图函数 @optimplotfval 求最小值的进度。
目标函数 onehump 出现在此示例末尾。
设置选项以使用 @optimplotfval 绘图函数。
options = optimset('PlotFcns',@optimplotfval);从点 x0 = [2,1] 开始调用 fminsearch。
x0 = [2 1];
[x fval] = fminsearch(@onehump,x0,options)
x = 1×2

   -0.6691    0.0000
fval =
-0.4052
示例:使用自定义绘图函数
您可以使用与输出函数相同的语法编写一个自定义绘图函数。有关此结构体的详细信息,请参阅优化求解器输出函数。
创建一个二维绘图函数,它显示标有迭代序号的迭代点。有关代码,请参阅此示例末尾的 myplot 辅助函数。使该绘图函数调用原始 @optimplotfval 绘图函数以及 myplot。
options.PlotFcns = {@myplot @optimplotfval};
[x fval] = fminsearch(@onehump,x0,options)
x = 1×2

   -0.6691    0.0000
fval =
-0.4052
自定义绘图函数会在求解器收敛于最终点 [-0.6691 0.0000] 时,以叠加方式大致绘制各次迭代的后一半。这使得迭代的后一半难以阅读。不过,该图仍然在一定程度上揭示了 fminsearch 如何向最小化点迭代。
辅助函数
以下代码创建 onehump 辅助函数。
function f = onehump(x)

r = x(1)^2 + x(2)^2;
s = exp(-r);
f = x(1)*s+r/20;
end
以下代码创建 myplot 辅助函数。
function stop = myplot(x,optimValues,state)
stop = false;
switch state
    case 'init'
          % Setup for plots or dialog boxes
          hold on
    case 'iter'
          % Make updates to plots or dialog boxes as needed
          plot(x(1),x(2),'rx');
          text(x(1)+.05,x(2),...
                num2str(optimValues.iteration));
    case 'done'
          % Cleanup of plots, dialog boxes, or final plot
          hold off
end
end