feather
创建以 x 轴为起点的箭头

说明
feather(___, 使用一个或多个名称-值参量设置绘图的属性。例如,您可以指定箭头的颜色和粗细。有关属性列表,请参阅 Line 属性。 (自 R2024b 起)Name=Value)
f = feather(___) 返回由包含 length(U)+1 个元素的 Line 对象组成的向量。前 length(U) 个元素表示各个箭头,最后一个元素表示沿 x 轴的水平线。创建绘图后,使用这些 Line 对象来控制绘图的外观。
示例
通过将每个箭头的分量指定为笛卡尔值来创建羽状图。第 n 个箭头以 x 轴上的 n 为起点。
t = -pi/2:pi/8:pi/2;
u = 10*sin(t);
v = 10*cos(t);
feather(u,v)

通过首先将极坐标转换为笛卡尔坐标,使用极坐标创建羽状图。
要完成此操作,请先用极坐标创建向量。使用 pol2cart 函数将它们转换为笛卡尔坐标。然后,创建绘图。
th = -pi/2:pi/16:0;
r = 10*ones(size(th));
[u,v] = pol2cart(th,r);
feather(u,v)

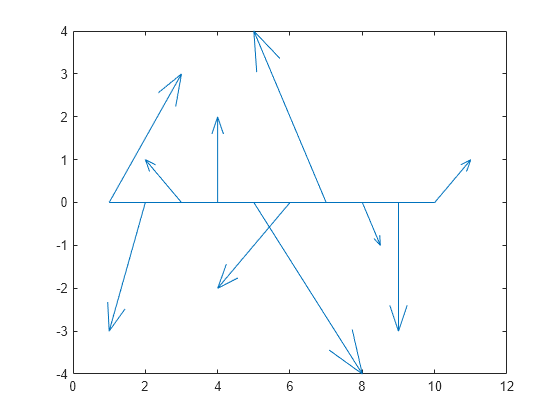
创建一个复数值向量。然后,使用羽状图显示这些复数值。实部确定每个箭头的 x 分量,虚部确定 y 分量。
Z = [2+3i -1-3i -1+i 2i 3-4i -2-2i -2+4i 0.5-i -3i 1+i];
feather(Z)
创建一个具有红色箭头的羽状图。
t = -pi/2:pi/8:pi/2;
u = 10*sin(t);
v = 10*cos(t);
feather(u,v,'r')
通过为单个箭头赋予变量,然后设置其属性来指定该箭头的线宽和颜色。要完成此操作,请先创建一个羽状图并返回一个 Line 对象数组。
t = -pi/2:pi/8:pi/2;
u = 10*sin(t);
v = 10*cos(t);
f = feather(u,v);
为第一个箭头赋予一个变量。第一个箭头对应于 u 和 v 的第一组元素。然后,更改线宽和颜色。
f1 = f(1);
f1.Color = 'r';
f1.LineWidth = 2;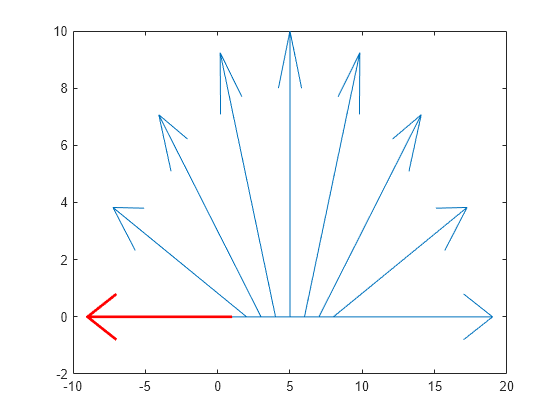
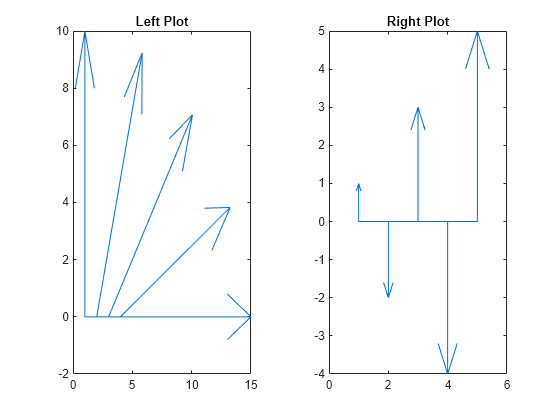
从 R2019b 开始,您可以使用 tiledlayout 和 nexttile 函数显示分块图。调用 tiledlayout 函数以创建 1×2 分块图布局。调用 nexttile 函数创建一个坐标区对象,并将该对象返回为 ax1。通过将 ax1 传递给 feather 函数来创建左图。通过将坐标区传递给 title 函数为绘图添加标题。重复上述过程以创建右图。
tiledlayout(1,2)

% Left plot
ax1 = nexttile;
t = 0:pi/8:pi/2;
u1 = 10*sin(t);
v1 = 10*cos(t);
feather(ax1,u1,v1)
title(ax1,'Left Plot')

% Right plot
ax2 = nexttile;
u2 = zeros(5,1);
v2 = [1 -2 3 -4 5];
feather(ax2,u2,v2)
title(ax2,'Right Plot')
输入参数
复数值,指定为标量、向量或矩阵。Z 的实部表示箭头的 x 分量,虚部表示 y 分量。
线型、标记和颜色,指定为包含符号的字符串标量或字符向量。符号可以按任意顺序显示。您不需要同时指定所有三个特征(线型、标记和颜色)。例如,如果忽略线型,只指定标记,则绘图只显示标记,不显示线条。
示例: "--or" 是带有圆形标记的红色虚线。
| 线型 | 描述 | 表示的线条 |
|---|---|---|
"-" | 实线 |
|
"--" | 虚线 |
|
":" | 点线 |
|
"-." | 点划线 |
|


| 标记 | 描述 | 生成的标记 |
|---|---|---|
"o" | 圆圈 |
|
"+" | 加号 |
|
"*" | 星号 |
|
"." | 点 |
|
"x" | 叉号 |
|
"_" | 水平线条 |
|
"|" | 垂直线条 |
|
"square" | 方形 |
|
"diamond" | 菱形 |
|
"^" | 上三角 |
|
"v" | 下三角 |
|
">" | 右三角 |
|
"<" | 左三角 |
|
"pentagram" | 五角形 |
|
"hexagram" | 六角形 |
|


| 颜色名称 | 短名称 | RGB 三元组 | 外观 |
|---|---|---|---|
"red" | "r" | [1 0 0] |
|
"green" | "g" | [0 1 0] |
|
"blue" | "b" | [0 0 1] |
|
"cyan" | "c" | [0 1 1] |
|
"magenta" | "m" | [1 0 1] |
|
"yellow" | "y" | [1 1 0] |
|
"black" | "k" | [0 0 0] |
|
"white" | "w" | [1 1 1] |
|


目标坐标区,指定为 Axes 对象。
名称-值参数
将可选参量对组指定为 Name1=Value1,...,NameN=ValueN,其中 Name 是参量名称,Value 是对应的值。名称-值参量必须出现在其他参量之后,但对各个参量对组的顺序没有要求。
示例: feather([1 2 3 4],[5 6 7 8],LineWidth=2) 绘制一个线条粗细为两磅的箭头。
注意
此处所列的属性只是一部分。有关完整列表,请参阅 Line 属性。
此外,还可以按名称指定一些常见的颜色。下表列出了一些命名颜色选项、其等效 RGB 三元组及十六进制颜色代码。
| 颜色名称 | 短名称 | RGB 三元组 | 十六进制颜色代码 | 外观 |
|---|---|---|---|---|
"red" | "r" | [1 0 0] | "#FF0000" |
|
"green" | "g" | [0 1 0] | "#00FF00" |
|
"blue" | "b" | [0 0 1] | "#0000FF" |
|
"cyan" | "c" | [0 1 1] | "#00FFFF" |
|
"magenta" | "m" | [1 0 1] | "#FF00FF" |
|
"yellow" | "y" | [1 1 0] | "#FFFF00" |
|
"black" | "k" | [0 0 0] | "#000000" |
|
"white" | "w" | [1 1 1] | "#FFFFFF" |
|
"none" | 不适用 | 不适用 | 不适用 | 无颜色 |
下表列出了浅色和深色主题中绘图的默认调色板。
| 调色板 | 调色板颜色 |
|---|---|
在 R2025a 之前的版本中: 大多数绘图默认使用这些颜色。 |
|
|
|


您可以使用 orderedcolors 和 rgb2hex 函数获取这些调色板的 RGB 三元组和十六进制颜色代码。例如,获取 "gem" 调色板的 RGB 三元组并将其转换为十六进制颜色代码。
RGB = orderedcolors("gem");
H = rgb2hex(RGB);
在 R2023b 之前的版本中: 使用 RGB = get(groot,"FactoryAxesColorOrder") 获取 RGB 三元组。
在 R2024a 之前的版本中: 使用 H = compose("#%02X%02X%02X",round(RGB*255)) 获取十六进制颜色代码。
示例: "blue"
示例: [0 0 1]
示例: "#0000FF"
线型,指定为下表中列出的选项之一。
| 线型 | 描述 | 表示的线条 |
|---|---|---|
"-" | 实线 |
|
"--" | 虚线 |
|
":" | 点线 |
|
"-." | 点划线 |
|
"none" | 无线条 | 无线条 |