fpolarplot

语法
说明
fpolarplot(___, 使用一个或多个名称-值参量指定线条属性。例如,Name=Value)LineWidth=2 指定 2 磅的线宽。
fpolarplot( 在由 pax,___)pax 指定的 PolarAxes 对象(而不是当前坐标区 (gca))中绘图。
fp = fpolarplot(___)FunctionLine 对象。使用该对象查询和修改所绘制线条的属性。有关属性列表,请参阅 FunctionLine 属性。
示例
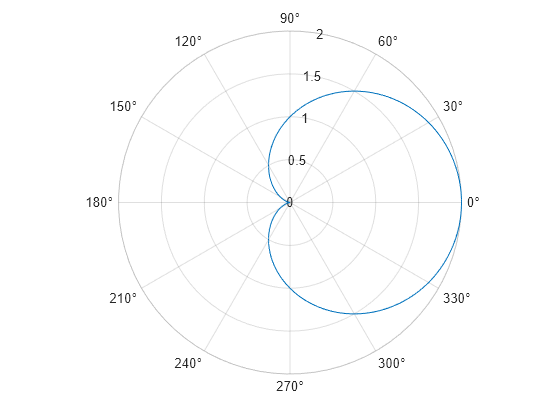
创建表达式 在区间 上的极坐标图。
f = @(t) 1 + cos(t);
fpolarplot(f)
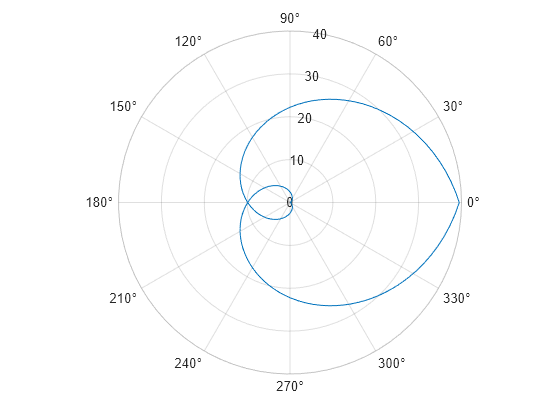
通过将绘图区间指定为 fpolarplot 的第二个输入,绘制 在区间 上的图。
f = @(t) t.^2;
fpolarplot(f,[-2*pi 2*pi])
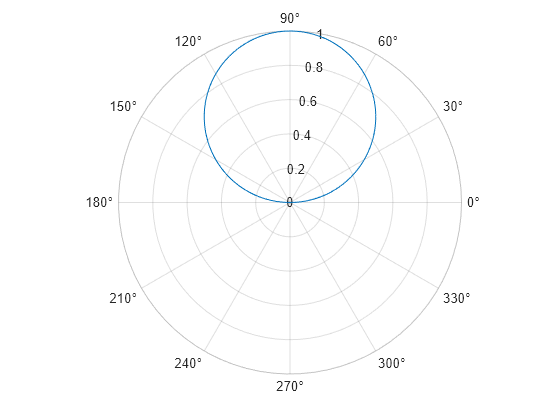
使用负半径值创建极坐标图。默认情况下,fpolarplot 会将负值反射穿过原点。
f = @(t) sin(t);
fpolarplot(f)
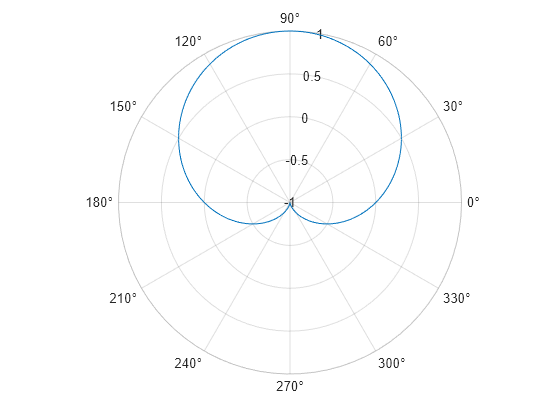
更改 轴的范围,使其从 -1 到 1。
rlim([-1 1])
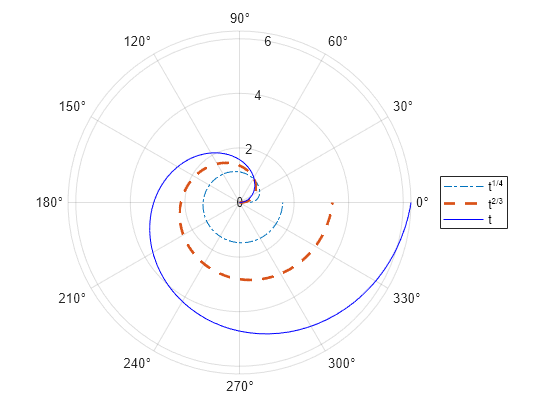
在极坐标中绘制三条曲线。第一条曲线使用点划线,第二条曲线使用线宽为 2 的虚线,第三条曲线使用蓝色实线。
fpolarplot(@(t) t.^(1/4),"-.")
hold on
fpolarplot(@(t) t.^(2/3),"--",LineWidth=2)
fpolarplot(@(t) t,"-b")
legend
hold off
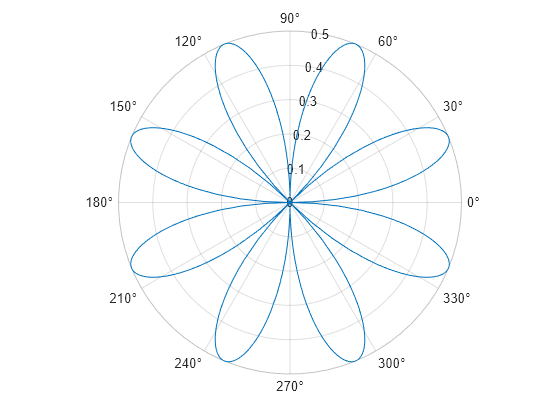
在极坐标中绘制曲线 ,并返回函数线条对象。
f = @(t) sin(2*t).*cos(2*t);
fp = fpolarplot(f)
fp =
  FunctionLine with properties:

     Function: @(t)sin(2*t).*cos(2*t)
        Color: [0.0660 0.4430 0.7450]
    LineStyle: '-'
    LineWidth: 0.5000

  Show all properties
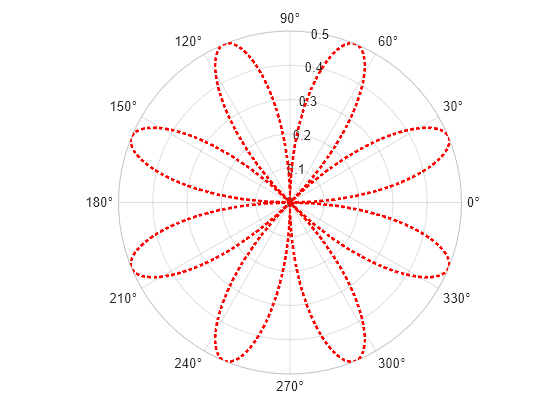
您可以使用圆点表示法访问和修改函数线条对象的属性。例如,更改颜色、线型和线宽。
fp.Color = "r";
fp.LineStyle = ":";
fp.LineWidth = 2;
输入参数
要绘制的函数,指定为命名或匿名函数的函数句柄。
指定 r = f(theta) 形式的函数。该函数必须接受向量输入参量,并返回大小相同的向量输出参量。为获得最佳性能,应使用数组运算符而不是矩阵运算符。例如,使用 .* (times) 而不是 * (mtimes)。
示例: fpolarplot(@(theta) theta.*sin(theta)) 在默认区间 [0 2*pi] 上绘制 theta.*sin(theta)。
极坐标角 theta 的区间,指定为 [a b] 形式的二元素向量。fpolarplot 绘制在指定的区间 a ≤ theta ≤ b 上的图。
PolarAxes 对象。您可以通过设置 PolarAxes 对象的属性来修改其外观和行为。有关属性列表,请参阅 PolarAxes 属性。
线型、标记和颜色,指定为包含符号的字符串标量或字符向量。符号可以按任意顺序显示。您不需要同时指定所有三个特征(线型、标记和颜色)。例如,如果忽略线型,只指定标记,则绘图只显示标记,不显示线条。
示例: "--or" 是带有圆形标记的红色虚线。
| 线型 | 描述 | 表示的线条 |
|---|---|---|
"-" | 实线 |
|
"--" | 虚线 |
|
":" | 点线 |
|
"-." | 点划线 |
|


| 标记 | 描述 | 生成的标记 |
|---|---|---|
"o" | 圆圈 |
|
"+" | 加号 |
|
"*" | 星号 |
|
"." | 点 |
|
"x" | 叉号 |
|
"_" | 水平线条 |
|
"|" | 垂直线条 |
|
"square" | 方形 |
|
"diamond" | 菱形 |
|
"^" | 上三角 |
|
"v" | 下三角 |
|
">" | 右三角 |
|
"<" | 左三角 |
|
"pentagram" | 五角形 |
|
"hexagram" | 六角形 |
|


| 颜色名称 | 短名称 | RGB 三元组 | 外观 |
|---|---|---|---|
"red" | "r" | [1 0 0] |
|
"green" | "g" | [0 1 0] |
|
"blue" | "b" | [0 0 1] |
|
"cyan" | "c" | [0 1 1] |
|
"magenta" | "m" | [1 0 1] |
|
"yellow" | "y" | [1 1 0] |
|
"black" | "k" | [0 0 0] |
|
"white" | "w" | [1 1 1] |
|


名称-值参数
将可选参量对组指定为 Name1=Value1,...,NameN=ValueN,其中 Name 是参量名称,Value 是对应的值。名称-值参量必须出现在其他参量之后,但对各个参量对组的顺序没有要求。
示例: fpolarplot(f,Marker="o",MarkerFaceColor="red")
此处所列的属性只是一部分。有关完整列表,请参阅 FunctionLine 属性。
此外,还可以按名称指定一些常见的颜色。下表列出了一些命名颜色选项、其等效 RGB 三元组及十六进制颜色代码。
| 颜色名称 | 短名称 | RGB 三元组 | 十六进制颜色代码 | 外观 |
|---|---|---|---|---|
"red" | "r" | [1 0 0] | "#FF0000" |
|
"green" | "g" | [0 1 0] | "#00FF00" |
|
"blue" | "b" | [0 0 1] | "#0000FF" |
|
"cyan" | "c" | [0 1 1] | "#00FFFF" |
|
"magenta" | "m" | [1 0 1] | "#FF00FF" |
|
"yellow" | "y" | [1 1 0] | "#FFFF00" |
|
"black" | "k" | [0 0 0] | "#000000" |
|
"white" | "w" | [1 1 1] | "#FFFFFF" |
|
下表列出了浅色和深色主题中绘图的默认调色板。
| 调色板 | 调色板颜色 |
|---|---|
在 R2025a 之前的版本中: 大多数绘图默认使用这些颜色。 |
|
|
|


您可以使用 orderedcolors 和 rgb2hex 函数获取这些调色板的 RGB 三元组和十六进制颜色代码。例如,获取 "gem" 调色板的 RGB 三元组并将其转换为十六进制颜色代码。
RGB = orderedcolors("gem");
H = rgb2hex(RGB);
在 R2023b 之前的版本中: 使用 RGB = get(groot,"FactoryAxesColorOrder") 获取 RGB 三元组。
在 R2024a 之前的版本中: 使用 H = compose("#%02X%02X%02X",round(RGB*255)) 获取十六进制颜色代码。
示例: "blue"
示例: [0 0 1]
示例: "#0000FF"
线型,指定为下表中列出的选项之一。
| 线型 | 描述 | 表示的线条 |
|---|---|---|
"-" | 实线 |
|
"--" | 虚线 |
|
":" | 点线 |
|
"-." | 点划线 |
|
"none" | 无线条 | 无线条 |
标记符号,指定为下表中列出的值之一。默认情况下,对象不显示标记。指定标记符号可在每个数据点或顶点添加标记。
| 标记 | 描述 | 生成的标记 |
|---|---|---|
"o" | 圆圈 |
|
"+" | 加号 |
|
"*" | 星号 |
|
"." | 点 |
|
"x" | 叉号 |
|
"_" | 水平线条 |
|
"|" | 垂直线条 |
|
"square" | 方形 |
|
"diamond" | 菱形 |
|
"^" | 上三角 |
|
"v" | 下三角 |
|
">" | 右三角 |
|
"<" | 左三角 |
|
"pentagram" | 五角形 |
|
"hexagram" | 六角形 |
|
"none" | 无标记 | 不适用 |
此外,还可以按名称指定一些常见的颜色。下表列出了一些命名颜色选项、其等效 RGB 三元组及十六进制颜色代码。
| 颜色名称 | 短名称 | RGB 三元组 | 十六进制颜色代码 | 外观 |
|---|---|---|---|---|
"red" | "r" | [1 0 0] | "#FF0000" |
|
"green" | "g" | [0 1 0] | "#00FF00" |
|
"blue" | "b" | [0 0 1] | "#0000FF" |
|
"cyan" | "c" | [0 1 1] | "#00FFFF" |
|
"magenta" | "m" | [1 0 1] | "#FF00FF" |
|
"yellow" | "y" | [1 1 0] | "#FFFF00" |
|
"black" | "k" | [0 0 0] | "#000000" |
|
"white" | "w" | [1 1 1] | "#FFFFFF" |
|
"none" | 不适用 | 不适用 | 不适用 | 无颜色 |
下表列出了浅色和深色主题中绘图的默认调色板。
| 调色板 | 调色板颜色 |
|---|---|
在 R2025a 之前的版本中: 大多数绘图默认使用这些颜色。 |
|
|
|
您可以使用 orderedcolors 和 rgb2hex 函数获取这些调色板的 RGB 三元组和十六进制颜色代码。例如,获取 "gem" 调色板的 RGB 三元组并将其转换为十六进制颜色代码。
RGB = orderedcolors("gem");
H = rgb2hex(RGB);
在 R2023b 之前的版本中: 使用 RGB = get(groot,"FactoryAxesColorOrder") 获取 RGB 三元组。
在 R2024a 之前的版本中: 使用 H = compose("#%02X%02X%02X",round(RGB*255)) 获取十六进制颜色代码。
示例: [0.3 0.2 0.1]
示例: "green"
示例: "#D2F9A7"
版本历史记录
在 R2024a 中推出