linkaxes
同步多个坐标区的范围
说明
linkaxes( 同步指定的坐标区向量的范围。同步范围允许您在一个绘图或图窗中缩放或平移,并在另一个绘图或图窗中显示相同的数据范围。当您第一次调用 ax)linkaxes 函数时,该函数选择的新范围涵盖所有指定坐标区的当前范围。
在 R2026a 之前的版本中: 当您调用 linkaxes 函数时,之前对该函数的调用所创建的所有链接都会取消。例如,如果您调用 linkaxes([ax1 ax2]),然后调用 linkaxes([ax2 ax3]),则第二次调用会取消 ax1 和 ax2 之间的链接。
示例
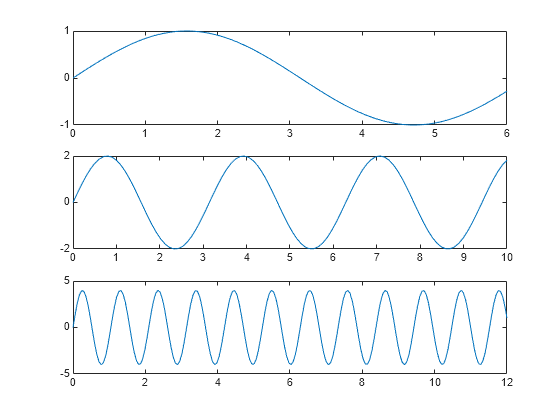
使用 tiledlayout 和 nexttile 函数显示分块图。
使用 tiledlayout 函数创建一个 3×1 分块图布局。然后,使用 ax1 函数创建坐标区对象 ax2、ax3 和 nexttile,并绘制到每个坐标区对象中。
tiledlayout(3,1)

% First plot
ax1 = nexttile;
x1 = linspace(0,6);
y1 = sin(x1);
plot(x1,y1)

% Second plot
ax2 = nexttile;
x2 = linspace(0,10);
y2 = 2*sin(2*x2);
plot(x2,y2)

% Third plot
ax3 = nexttile;
x3 = linspace(0,12,200);
y3 = 4*sin(6*x3);
plot(x3,y3)
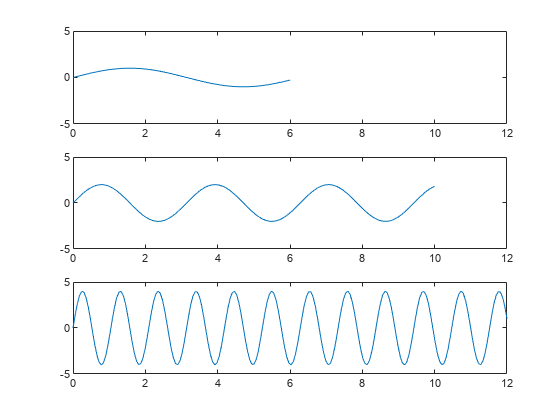
同步三个绘图的坐标区范围。请注意,新坐标区范围涵盖了旧范围。
linkaxes([ax1 ax2 ax3])
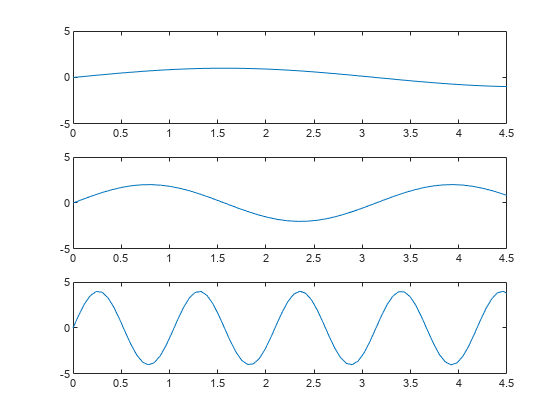
为第一个绘图设置 x 轴范围。所有 x 轴均已链接,因此第二个绘图和第三个绘图中的 x 轴范围也会更改。
ax1.XLim = [0 4.5];
在其中一个绘图中平移或缩放会在另外两个绘图中显示相同的数据范围。
要删除链接,请使用 linkaxes([ax1 ax2 ax3],"off")。
使用 linkaxes 函数同步和修改多个坐标区对象的 x 轴范围。
使用 tiledlayout 和 nexttile 函数显示分块图。使用 tiledlayout 函数创建一个 2×1 分块图布局。然后,使用 nexttile 函数创建坐标区对象 ax1 和 ax2,并绘制到每个坐标区对象中。
t = tiledlayout(2,1);

% First plot
ax1 = nexttile;
p1 = peaks;
surf(ax1,p1)
view(3)

% Second plot
ax2 = nexttile;
p2 = peaks(25);
mesh(ax2,p2)
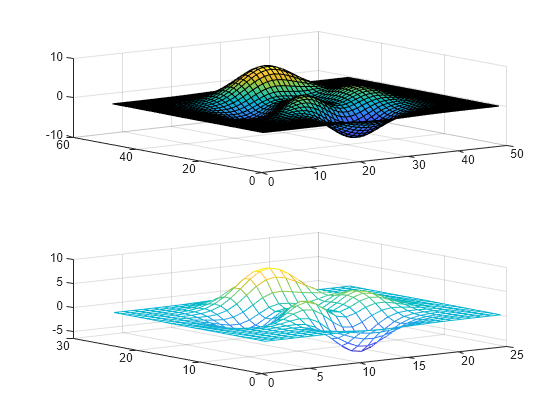
同步两个坐标区对象的 x 轴范围。新链接的坐标区对象的 x 轴范围会更新以涵盖所有数据。
linkaxes([ax1 ax2],"x")通过仅为其中一个坐标区对象设置 x 轴范围,更新所有链接的坐标区对象的 x 轴范围。
ax1.XLim = [0 15];
ax2.XLim
ans = 1×2

     0    15
通过关闭同步来删除链接。
linkaxes([ax1 ax2],"off")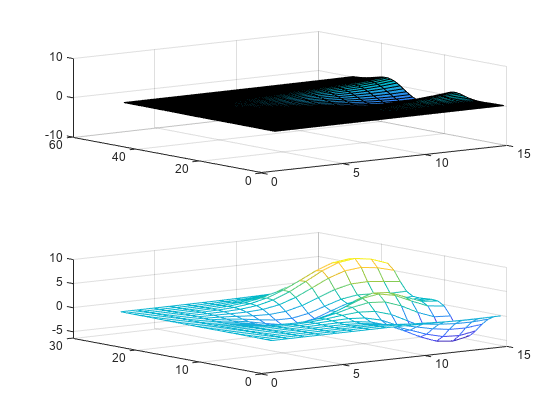
当比较不同时区的两个日期时间值图时,请设置其中一个标尺的 ReferenceDate 属性,以便两个图反映相同的时区。
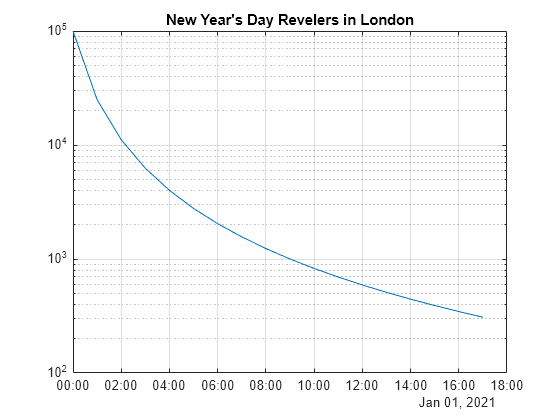
创建一个包含两个绘图的分块图,比较 2021 年 1 月 1 日伦敦和纽约的元旦狂欢人数。首先在第一个图块中绘制伦敦的数据。默认情况下,绘图使用数据的时区。
London = datetime(2021,1,1,0:17,0,0,"TimeZone","Europe/London");
y = (1./(1:18).^2) * 100000;
ax1 = nexttile;
semilogy(ax1,London,y)
grid on
title("New Year's Day Revelers in London")
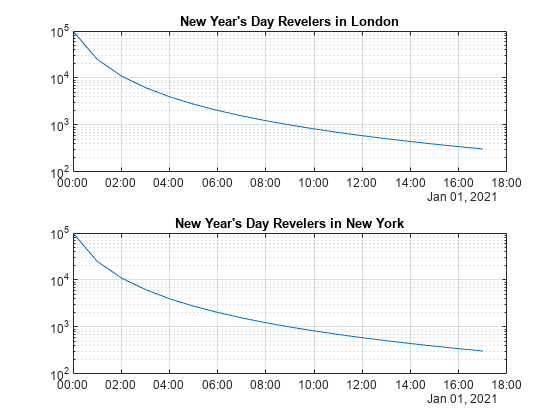
绘制纽约的数据。第二个绘图位于纽约的时区,因此您无法通过目测轻松比较同一时间点两个位置的狂欢者人数。
NY = datetime(2021,1,1,0:17,0,0,"TimeZone","America/New_York");
ax2 = nexttile;
semilogy(ax2,NY,y)
grid on
title("New Year's Day Revelers in New York")
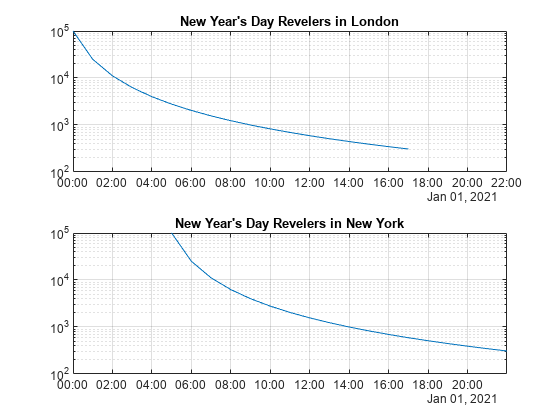
通过将 x 轴的参考日期设置为时区 "Europe/London" 中的日期时间值,更改纽约绘图的时区。然后关联两个轴。因此,两个绘图反映相同的时区。
ax2.XAxis.ReferenceDate = datetime(2022,1,1,"TimeZone","Europe/London");
linkaxes([ax1,ax2],"x")
输入参数
版本历史记录
在 R2006a 之前推出另请参阅
linkprop | linkdata | tiledlayout | nexttile