rotate3d
启用旋转模式
说明
您可以使用旋转模式,通过以交互方式旋转坐标区的三维视图来浏览数据。使用 rotate3d 函数启用或禁用旋转模式,并设置其他基本选项。要进一步控制旋转模式行为,请返回并使用 rotate3d 对象。
大多数三维图都支持旋转模式,包括三维气泡图、三维散点图和曲面图。支持旋转模式的图通常在坐标区工具栏中显示“三维旋转” 按钮。
您还可以使用默认情况下启用的内置坐标区交互来以交互方式浏览数据。例如,您可以通过拖动坐标区来旋转三维坐标区的视图。内置交互不要求您启用交互模式,并且比交互模式响应更快。但是,您可以启用旋转模式来自定义旋转行为。有关内置交互的详细信息,请参阅对图的交互进行控制。
创建对象
描述
rotate3d 为当前图窗中的所有坐标区设置旋转模式。例如,optionrotate3d on 启用旋转模式,而 rotate3d off 禁用旋转模式。
在启用了旋转模式时,使用光标或键盘可旋转坐标区的视图。
光标 - 点击并在坐标区中拖动光标。
键盘 - 要增大或减小方位角,请按向右箭头 (→) 键或向左箭头 (←) 键。要增大或减小高度,请按向上箭头 (↑) 键或向下箭头 (↓) 键。
不管当前交换模式如何,某些内置交互都默认处于启用状态。要禁用独立于旋转模式的内置旋转交互,请使用 disableDefaultInteractivity 函数。
rotate3d 切换旋转模式。例如,如果禁用了旋转模式,则调用 rotate3d 会启用旋转模式。
输入参量
属性
对象函数
注意
如果您为 rotate3d 对象调用任一上述对象函数,则 MATLAB 会在图窗上启用旧探索模式。有关详细信息,请参阅 enableLegacyExplorationModes。
使用 rotate3d 对象函数自定义图窗中坐标区对象的旋转行为。对于所有这些函数,坐标区和旋转模式对象必须与同一图窗相关联。
|
如果对 使用 注意 您可以通过设置坐标区的 |
|
如果对 使用 注意 您可以通过查询坐标区的 |
示例
创建三维绘图并启用旋转模式。然后,以交互方式旋转坐标区。
surf(peaks)
rotate3d on
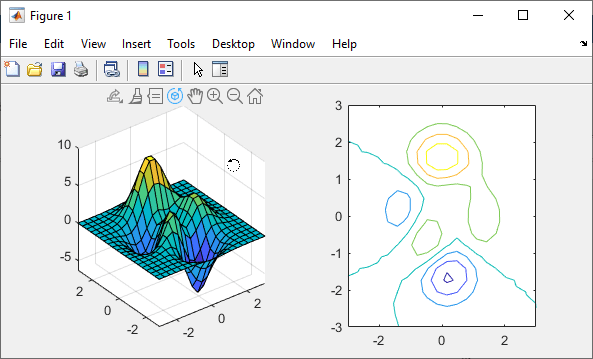
在一个分块图布局中创建两个坐标区,并仅对第一个坐标区启用旋转模式。点击每个子图中的“展开坐标区工具栏” 按钮以查看其工具栏。
tiledlayout(1,2)
ax1 = nexttile;
surf(peaks)

ax2 = nexttile;
contour(peaks)

rotate3d(ax1,"on")
为要触发的旋转模式对象创建一个按钮按下回调。将以下代码复制到新文件,执行它,并观察旋转行为。
function demo_mbd
    % Allow a line to have its own ButtonDownFcn callback
    hLine = plot(rand(1,10));
    hLine.ButtonDownFcn = "disp(""This executes"")";
    hLine.Tag = "DoNotIgnore";
    h = rotate3d;
    h.ButtonDownFilter = @mycallback;
    h.Enable = "on";
    % Mouse click on the line
end

function [flag] = mycallback(obj,event_obj)
    % If the tag of the object is "DoNotIgnore", then return true

    % Indicate what the target is
    disp("Clicked " + obj.Type + " object")
    objTag = obj.Tag;
    if strcmpi(objTag,"DoNotIgnore")
        flag = true;
    else
        flag = false;
    end
end
详细信息
替代功能
坐标区工具栏
对于某些图,通过点击坐标区工具栏中的“三维旋转” 按钮来启用旋转模式。