Pivot Table
Description
The Pivot Table task lets you interactively summarize tabular data in a pivoted table according to column and row groups. The task automatically generates MATLAB® code for your live script. For more information about Live Editor tasks generally, see Add Interactive Tasks to a Live Script.
A pivoted table provides a summary of tabular data. Pivoted tables are useful for analyzing and providing insights into large data sets and organizing data from another perspective, according to column and row groups. The column and row labels of a pivoted table are group names, and the data values are group counts or the result of another computation method. For more information, see Pivoting Operation or watch How to Create Pivot Tables in MATLAB (4 min, 11 sec).
Using this task, you can:
Create a pivoted table and specify grouping variables to designate pivoted table rows and columns.
Focus on a subset of rows by filtering the input table.
View sparklines and summary statistics to quickly visualize and interpret the data in each table or timetable variable.
Fill the values of the pivoted table by specifying the computation method and table variable.
Customize the format and contents of the pivoted table.
Visualize the pivoted table in a chart.
For more information on Live Editor tasks, see Add Interactive Tasks to a Live Script.
Related Functions
Pivot Table generates code that uses the pivot
function.
Open the Task
To add the Pivot Table task to a live script in the MATLAB Editor:
On the Live Editor tab, select Task > Pivot Table.
In a code block in the script, type a relevant keyword, such as
pivot,group,crosstab, orheatmap. SelectPivot Tablefrom the suggested command completions. For some keywords, the task automatically updates one or more corresponding parameters.
Examples
Interactively compute the group counts for table data for groups defined by a logical grouping variable and a discretized numeric grouping variable using the Pivot Table Live Editor task.
Create a table from a file that contains information about 100 hospital patients.
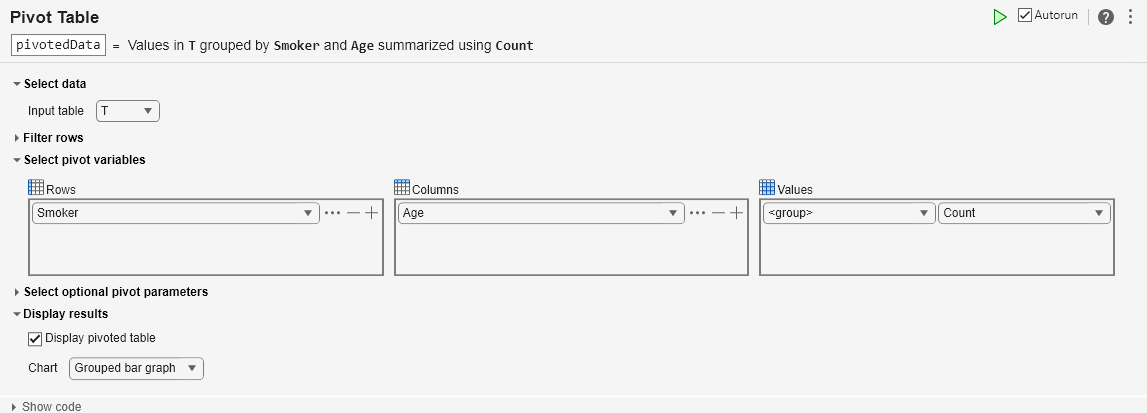
T = readtable("patients.xls");Open the Pivot Table task in the Live Editor. To understand the relationship between two variables, specify grouping variables to designate the pivoted table rows and variables. Select the Smoker variable in the Rows panel, and select the Age variable in the Columns panel.
By default, the Pivot Table task fills the data values of the pivoted table with the number of members in each group. The Values panel shows that group counts fill the pivoted table.
There are 25 unique values in the Age variable, which makes the default pivoted table difficult to interpret. Reduce the number of variables in the pivoted table by creating 5 evenly spaced bins for the Age grouping variable. Apply a binning method to Age by clicking the ![]() button and specifying the number of bins as 5.
button and specifying the number of bins as 5.

The resulting pivoted table contains the number of elements in each age range for smoking and nonsmoking patients. Visualize the counts in a grouped bar graph using the Chart field.
pivotedData=2×5 table
             [25, 30)    [30, 35)    [35, 40)    [40, 45)    [45, 50]
             ________    ________    ________    ________    ________

    false       11          9           18          12          16
    true         4          7            7           8           8
![Figure contains an axes object. The axes object with title Values in T grouped by Smoker and Age summarized using Count contains 5 objects of type bar. These objects represent [25, 30), [30, 35), [35, 40), [40, 45), [45, 50].](../../examples/matlab/win64/BinGroupingVariableExample_03.png)
Interactively select a subset of tabular data and summarize the filtered data in a pivoted table using the Pivot Table Live Editor task.
Create a table from a file that contains information about 100 hospital patients.
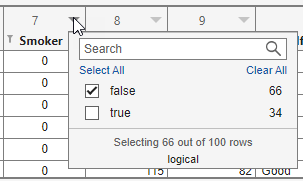
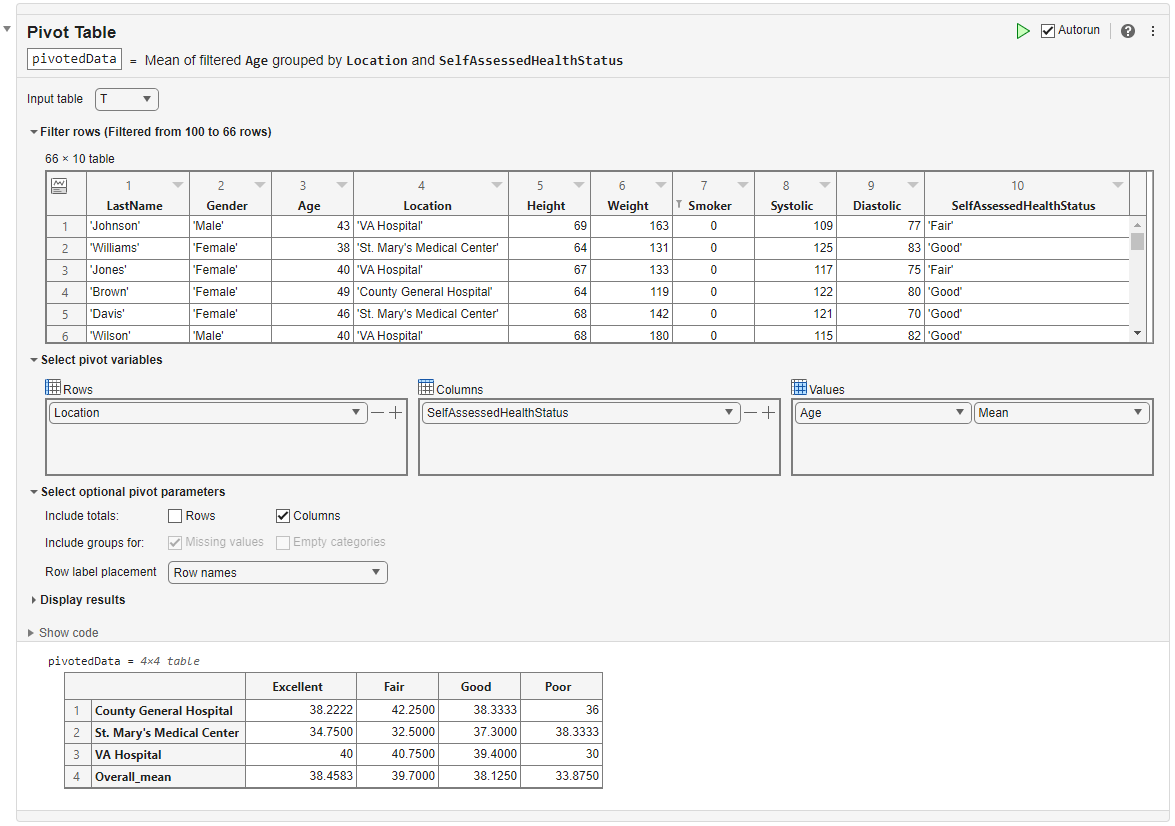
T = readtable("patients.xls");Open the Pivot Table task in the Live Editor. Expand the Filter rows section, and click the triangle icon in the header of the Smoker variable. Apply a filter to focus only on rows in the input table that correspond to nonsmoking patients. The resulting table is filtered from 100 to 66 rows.
Then, specify the grouping variables. Select the Location variable in the Rows panel, and select the SelfAssessedHealthStatus variable in the Columns panel.
By default, the Pivot Table task fills the data values of the pivoted table with the number of members in each group. Instead, fill the pivoted table with the average age of each group. Select the Age variable and the Mean computation method in the Values panel.
The resulting pivoted table contains the average age of nonsmoking patients reporting each health status for each hospital location. To include the average age for each health status regardless of the location, select Include totals for columns in the Select optional pivot parameters section.
pivotedData=4×4 table
                                 Excellent    Fair      Good      Poor
                                 _________    _____    ______    ______

    County General Hospital       38.222      42.25    38.333        36
    St. Mary's Medical Center      34.75       32.5      37.3    38.333
    VA Hospital                       40      40.75      39.4        30
    Overall_mean                  38.458       39.7    38.125    33.875
Related Examples
Parameters
Select the name of the input table or timetable from the list of all the nonempty tables and timetables that are in the workspace.
Apply a filter to focus only on rows in the input table that satisfy the filtering condition. Expand the Filter rows section of the task, click the triangle icon in the header of a table variable, and use the options to interactively select a subset of the data.
For example, pivot only rows corresponding to patients who are at least 29 years old.

You can also quickly visualize and interpret the data in each table or timetable variable using sparklines and summary statistics by clicking the icon in the header of the table row numbers.
Click the Add button. Then, select a table or timetable variable.
To aggregate the variable into bins, click the button and select a binning method.
To remove or add other grouping variables, click the – or + button to the right of the grouping variable. When you add another grouping variable, a new drop-down list of variable names and any applicable binning options appears below the previous grouping variable.
Select the data values for the pivoted table. Choose
<group> followed by Count or
Percentage, or choose a data variable from the input table
to rearrange or aggregate. For aggregation, select from the provided statistics or
select Custom function to specify a function handle or write
a local function.
Tips
The Pivot Table task can apply the computation method to at most one data variable. To apply multiple computation methods or specify multiple data variables, use the Compute by Group task.