timeseries2timetable
将 timeseries 对象转换为时间表
说明
TT = timeseries2timetable( 将 ts)timeseries 对象转换为一个时间表。
如果
ts是timeseries对象,则TT是具有一个变量的时间表。如果
ts是由timeseries对象组成的数组,则TT是一个包含的变量数与ts中的timeseries对象数相同的时间表。ts中的所有timeseries对象必须具有相同的采样时间。如果任一
timeseries对象具有多个事件,则该函数将这些事件转换为一个事件表,并将该事件表附加到TT。重复事件会导致事件表中出现重复的行。 (自 R2024b 起)
示例
创建一个包含五个随机数的 timeseries 对象,以 10 秒为间隔进行采样。
ts = timeseries(rand(5,1),[0 10 20 30 40])
  timeseries

  Common Properties:
            Name: 'unnamed'
            Time: [5x1 double]
        TimeInfo: [1x1 tsdata.timemetadata]
            Data: [5x1 double]
        DataInfo: [1x1 tsdata.datametadata]

  More properties, Methods
显示 ts 中的时间和数据。
ts.Time
ans = 5×1

     0
    10
    20
    30
    40
ts.Data
ans = 5×1

    0.8147
    0.9058
    0.1270
    0.9134
    0.6324
将 ts 转换为一个时间表。
TT = timeseries2timetable(ts)
TT=5×1 timetable
     Time      Data
    ______    _______

    0 sec     0.81472
    10 sec    0.90579
    20 sec    0.12699
    30 sec    0.91338
    40 sec    0.63236
创建一个 timeseries 对象数组。使用相同的采样时间向量,但为时间序列提供不同的名称。使用 rand 函数创建不同的数据值数组。
ts1 = timeseries(rand(5,1),[0 10 20 30 40],"Name","Series_1");
ts2 = timeseries(rand(5,1),[0 10 20 30 40],"Name","Series_2");
ts3 = timeseries(rand(5,1),[0 10 20 30 40],"Name","Series_3");
ts = [ts1 ts2 ts3]
  1×3 timeseries array with properties:

    Events
    Name
    UserData
    Data
    DataInfo
    Time
    TimeInfo
    Quality
    QualityInfo
    IsTimeFirst
    TreatNaNasMissing
    Length
将来自所有 timeseries 对象的数据合并到一个时间表中。数组中的每个时间序列都为该时间表提供一个变量。
TT = timeseries2timetable(ts)
TT=5×3 timetable
     Time     Series_1    Series_2    Series_3
    ______    ________    ________    ________

    0 sec     0.81472     0.09754     0.15761
    10 sec    0.90579      0.2785     0.97059
    20 sec    0.12699     0.54688     0.95717
    30 sec    0.91338     0.95751     0.48538
    40 sec    0.63236     0.96489     0.80028
将多个 timeseries 对象转换为一个时间表。
ts1 = timeseries(rand(5,1),[0 10 20 30 40],"Name","Series_1");
ts2 = timeseries(rand(5,1),[0 10 20 30 40],"Name","Series_2");
ts3 = timeseries(rand(5,1),[0 10 20 30 40],"Name","Series_3");
TT = timeseries2timetable(ts1,ts2,ts3)
TT=5×3 timetable
     Time     Series_1    Series_2    Series_3
    ______    ________    ________    ________

    0 sec     0.81472     0.09754     0.15761
    10 sec    0.90579      0.2785     0.97059
    20 sec    0.12699     0.54688     0.95717
    30 sec    0.91338     0.95751     0.48538
    40 sec    0.63236     0.96489     0.80028
加载三个 timeseries 对象,这些对象包含三个城市交叉路口的交通数据。
load trafficCounts.mat count1 count2 count3
显示第一个 timeseries 对象的属性。这些属性存储交通数据、收集数据的时间和两个事件。事件是 tsdata.event 对象。
count1
  timeseries

  Common Properties:
            Name: 'Intersection1'
            Time: [15x1 double]
        TimeInfo: [1x1 tsdata.timemetadata]
            Data: [15x1 double]
        DataInfo: [1x1 tsdata.datametadata]
          Events: [1x2 tsdata.event]

  More properties, Methods
显示附加到 count1 的第一个事件。
count1.Events(1)
    EventData: []
         Name: 'AMCommute'
         Time: 8
        Units: 'hours'
    StartDate: ''
显示第二个事件。这些事件标记早晚通勤的时间。
count1.Events(2)
    EventData: []
         Name: 'PMCommute'
         Time: 18
        Units: 'hours'
    StartDate: ''
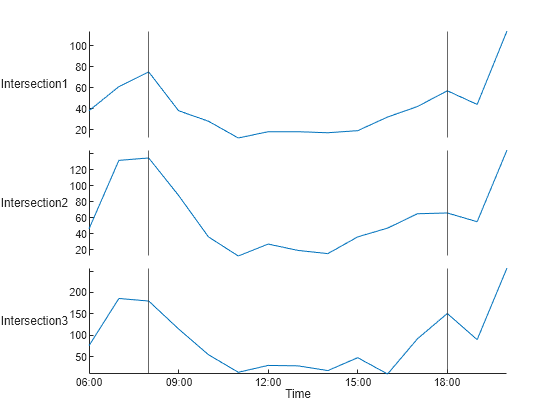
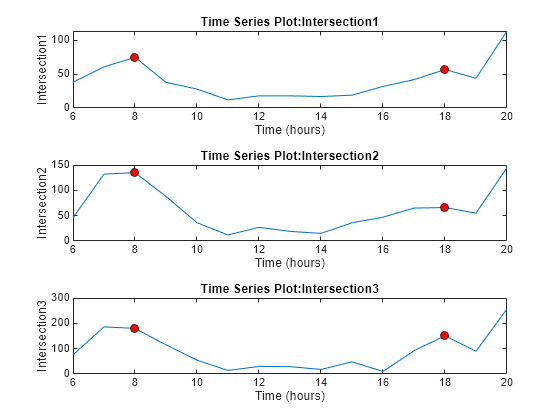
绘制来自三个 timeseries 对象的数据。要创建一个分块图布局以在子图中显示时间序列,请使用 tiledlayout 函数。图显示红点来标记与三个时间序列相关联的事件。
tiledlayout(3,1)
nexttile
plot(count1)
nexttile
plot(count2)
nexttile
plot(count3)
将三个 timeseries 对象转换为一个时间表。将行时间的格式设置为 hh:mm 格式。这些事件在三个时间序列中的相同时间发生,因此时间表在 08:00 和 18:00 都有三个事件标签。
TT = timeseries2timetable(count1,count2,count3);
TT.Time.Format = "hh:mm"TT=15×3 timetable with 6 events
Time Intersection1 Intersection2 Intersection3
_____ _____________ _____________ _____________
06:00 38 46 76
07:00 61 132 186
<3 events> 08:00 75 135 180
09:00 38 88 115
10:00 28 36 55
11:00 12 12 14
12:00 18 27 30
13:00 18 19 29
14:00 17 15 18
15:00 19 36 48
16:00 32 47 10
17:00 42 65 92
<3 events> 18:00 57 66 151
19:00 44 55 90
20:00 114 145 257
该转换还将事件对象转换为一个事件表。该事件表附加到时间表。事件表显示它在两个时间有三个相同的事件。
TT.Properties.Events
ans = 6×1 eventtable
  Event Labels Variable: EventLabels
  Event Lengths Variable: <instantaneous>

    Time     EventLabels
    _____    ___________

    8 hr     "AMCommute"
    8 hr     "AMCommute"
    8 hr     "AMCommute"
    18 hr    "PMCommute"
    18 hr    "PMCommute"
    18 hr    "PMCommute"
您可以清除包含重复事件的事件表。一种方法是使用 unique 函数。
ET = TT.Properties.Events;
ET = unique(ET)
ET = 2×1 eventtable
  Event Labels Variable: EventLabels
  Event Lengths Variable: <instantaneous>

    Time     EventLabels
    _____    ___________

    8 hr     "AMCommute"
    18 hr    "PMCommute"
将清理后的事件表附加到时间表。显示时间表。
TT.Properties.Events = ET
TT=15×3 timetable with 2 events
                 Time     Intersection1    Intersection2    Intersection3
                 _____    _____________    _____________    _____________

                 06:00          38               46               76
                 07:00          61              132              186
    AMCommute    08:00          75              135              180
                 09:00          38               88              115
                 10:00          28               36               55
                 11:00          12               12               14
                 12:00          18               27               30
                 13:00          18               19               29
                 14:00          17               15               18
                 15:00          19               36               48
                 16:00          32               47               10
                 17:00          42               65               92
    PMCommute    18:00          57               66              151
                 19:00          44               55               90
                 20:00         114              145              257
创建一个图,其中包含时间表中的交通数据。首先创建一个新图窗窗口,这样您就不会重用由 tiledlayout 创建的子图。然后,使用 stackedplot 来绘制时间表中的数据。stackedplot 函数将每个时间表变量绘制在一个对应的子图中,并在事件发生的时间处显示黑色竖线。
figure
stackedplot(TT)