uitreenode
创建树节点组件
语法
说明
node = uitreenodeTreeNode 对象。MATLAB® 调用 uifigure 函数来创建该图窗。
node = uitreenode(parent)Tree 或 TreeNode 对象。
node = uitreenode(___,Name,Value)Name,Value 对组参量指定 TreeNode 属性值。使用上述任何语法时,可以指定 Name,Value 作为最后一组参量。
示例
创建一个树,其中包含名为 Sample Data 的父节点和名为 Sample 1 的子节点。展开该树以查看这两个节点。
fig = uifigure;
t = uitree(fig);
parent = uitreenode(t,"Text","Sample Data");
child = uitreenode(parent,"Text","Sample 1");
expand(t)
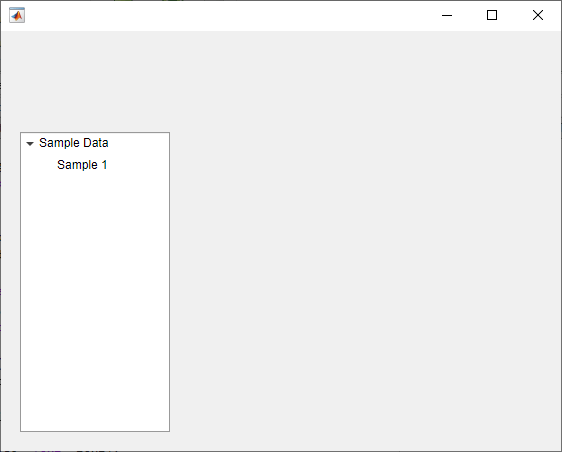
创建一个包含父节点和子节点的树。展开该树以查看这两个节点。
fig = uifigure;
t = uitree;
p = uitreenode(t,"Text","Teas");
c1 = uitreenode(p,"Text","Green Tea");
expand(t);
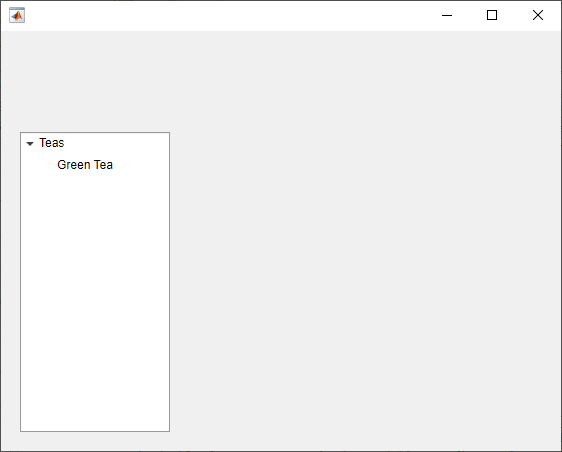
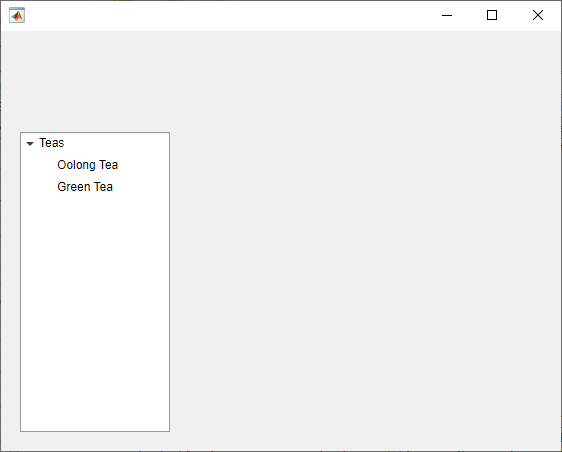
在树中 c1 节点的上方添加一个新的子节点。
c2 = uitreenode(p,c1,"before","Text","Oolong Tea");
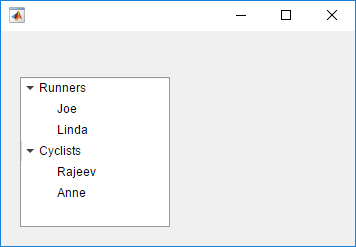
创建一个按运动项目分组显示运动员姓名的 App。当 App 用户点击一个姓名时,MATLAB 会显示该运动员的相关数据。
创建一个名为 mytreeapp.m 的程序文件,并在其中包含下列代码,以创建树、一组嵌套的树节点和一个回调函数。SelectionChangedFcn 属性指定当用户点击树中的节点时要执行的函数。
function mytreeapp
    fig = uifigure;
    t = uitree(fig,"Position",[20 20 150 150]);

    % Assign callback in response to node selection
    t.SelectionChangedFcn = @nodechange;

    % First level nodes
    category1 = uitreenode(t,"Text","Runners","NodeData",[]);
    category2 = uitreenode(t,"Text","Cyclists","NodeData",[]);

    % Second level nodes.
    % Node data is age (y), height (m), weight (kg)
    p1 = uitreenode(category1,"Text","Joe","NodeData",[40 1.67 58] );
    p2 = uitreenode(category1,"Text","Linda","NodeData",[49 1.83 90]);
    p3 = uitreenode(category2,"Text","Rajeev","NodeData",[25 1.47 53]);
    p4 = uitreenode(category2,"Text","Anne","NodeData",[88 1.92 100]);

    % Expand the tree
    expand(t);

    % Create the function for the SelectionChangedFcn callback
    % When the function is executed, it displays the data of the selected item
    function nodechange(src,event)
        node = event.SelectedNodes;
        display(node.NodeData);
    end
end
当用户运行 mytreeapp 并点击树中的节点时,MATLAB 将显示该节点的 NodeData。
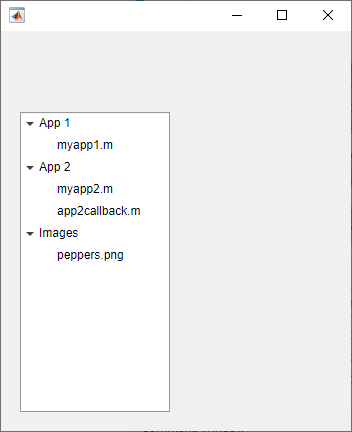
为显示文件结构的树节点添加样式,以便在视觉上区分不同文件类型。
创建一个树 UI 组件。每个顶层节点表示一个文件夹。每个子节点表示该文件夹中的一个文件。展开树以查看所有节点。
fig = uifigure("Position",[300 300 350 400]);
t = uitree(fig);

% Parent nodes
n1 = uitreenode(t,"Text","App 1");
n2 = uitreenode(t,"Text","App 2");
n3 = uitreenode(t,"Text","Images");

% Child nodes
n11 = uitreenode(n1,"Text","myapp1.m");
n21 = uitreenode(n2,"Text","myapp2.m");
n22 = uitreenode(n2,"Text","app2callback.m");
n31 = uitreenode(n3,"Text","peppers.png");

expand(t)
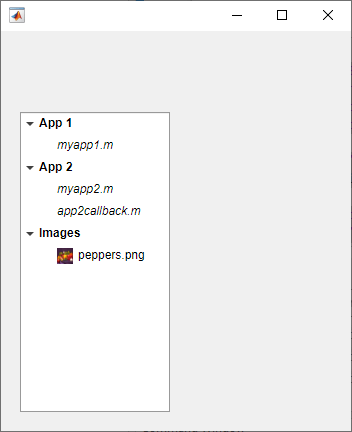
创建三个样式:一个具有加粗字体,一个具有倾斜字体角度,一个具有图标。
dirStyle = uistyle("FontWeight","bold");
mStyle = uistyle("FontAngle","italic");
imgStyle = uistyle("Icon","peppers.png");
将粗体样式应用于顶层节点,以区分表示文件夹的节点。将斜体样式应用于 App 1 和 App 2 节点的子节点,以区分表示 MATLAB 程序文件的节点。最后,将图标样式应用于表示一个图像文件的节点,以显示该图像的预览。
addStyle(t,dirStyle,"level",1)
addStyle(t,mStyle,"node",[n1.Children;n2.Children])
addStyle(t,imgStyle,"node",n31)
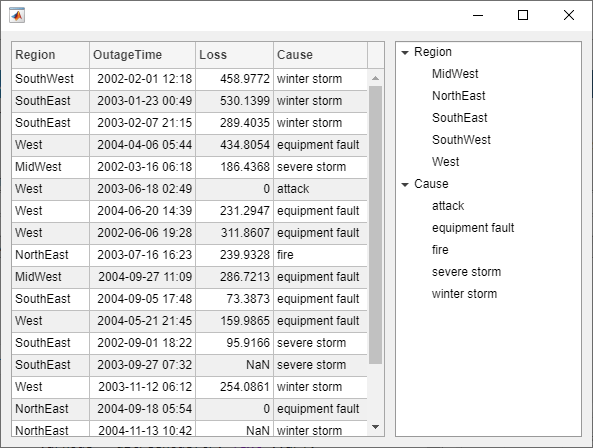
创建一个基于表中数据填充节点的树。
使用网格布局管理器创建一个图窗来容纳 UI 组件。加载电力公司停电的采样数据,并创建一个表 UI 组件来显示该数据。然后,创建一个树来容纳列出断电区域和原因的节点。
fig = uifigure;
gl = uigridlayout(fig,[1 2]);
gl.ColumnWidth = {'2x','1x'};

T = readtable("outages.csv");
T = T(1:20,["Region","OutageTime","Loss","Cause"]);
tbl = uitable(gl,"Data",T);

tr = uitree(gl);
指定要在树中显示的表变量。对于其中每一个变量,创建一个顶层节点,其文本就是变量名称。通过将变量的表条目转换为分类数组并将分类列表返回为 names,提取相关数据。然后,遍历各类别。对于每个元素,向树中适当的父节点下添加一个节点。
vars = ["Region","Cause"];

for k1 = 1:length(vars)
    var = vars{k1};
    varnode = uitreenode(tr,"Text",var);
    rows = T{:,var};
    names = categories(categorical(rows));

    for k2 = 1:length(names)
        text = names{k2};
        uitreenode(varnode,"Text",text);
    end
end
展开树以查看所有节点。
expand(tr)
为树组件创建一个上下文菜单。将该上下文菜单分配给树中的所有顶层节点。
在当前文件夹的新脚本中,创建一个 UI 图窗。然后,创建一个树,其中包含四个顶层节点和一组嵌套节点。
fig = uifigure;

t = uitree(fig,"Position",[20 200 175 100]);

category1 = uitreenode(t,"Text","Runners");
r1 = uitreenode(category1,"Text","Joe");
r2 = uitreenode(category1,"Text","Linda");

category2 = uitreenode(t,"Text","Cyclists");
c1 = uitreenode(category2,"Text","Rajeev");

category3 = uitreenode(t,"Text","Hikers");
h1 = uitreenode(category3,"Text","Jack");

category4 = uitreenode(t,"Text","Swimmers");
s1 = uitreenode(category4,"Text","Logan");
![]()
创建一个上下文菜单,其中包含一个菜单项和两个子菜单,用户可以点击该上下文菜单来展开单个树节点或所有树节点。对于每个子菜单,指定当用户选择菜单选项时要执行的 MenuSelectedFcn 回调函数。将相关的 App 对象作为输入传递给每个函数,以便从回调函数中访问 App 数据。
cm = uicontextmenu(fig);
m1 = uimenu(cm,"Text","Expand...");

sbm1 = uimenu(m1,"Text","This Node", ...
    "MenuSelectedFcn",{@expandSingle,fig});
sbm2 = uimenu(m1,"Text","All Nodes", ...
    "MenuSelectedFcn",{@expandAll,t});
通过将每个节点的 ContextMenu 属性设置为 ContextMenu 对象,将上下文菜单分配给顶层树节点。
category1.ContextMenu = cm;
category2.ContextMenu = cm;
category3.ContextMenu = cm;
category4.ContextMenu = cm;
在文件的底部,定义 expandSingle 和 expandAll 回调函数。定义函数来接受 MATLAB 传递给所有回调函数的源和事件数据。
定义 expandSingle 函数来同时接受包含树的 UI 图窗对象,并使用图窗的 CurrentObject 属性来确定点击哪个树节点来显示上下文菜单。然后,展开该节点。
定义 expandAll 函数来同时接受树对象,并展开树中的所有节点。
function expandSingle(src,event,f)
node = f.CurrentObject;
expand(node)
end

function expandAll(src,event,t)
expand(t)
end
保存并运行脚本。右键点击任一顶层树节点可查看上下文菜单。
![]()
输入参数
父对象,指定为 Tree 或 TreeNode 对象。
同级节点,指定为 TreeNode 对象。
相对于同级节点的位置,指定为 "after" 或 "before"。
名称-值参数
以 Name1=Value1,...,NameN=ValueN 的形式指定可选参量对组,其中 Name 是参量名称,Value 是对应的值。名称-值参量必须出现在其他参量之后,但参量对组的顺序无关紧要。
示例: node = uitreenode(t,Text="Measurements") 创建带有标签 "Measurements" 的树节点。
在 R2021a 之前,使用逗号分隔每个名称和值,并用引号将 Name 引起来。
示例: node = uitreenode(t,"Text","Measurements") 创建带有标签 "Measurements" 的树节点。
注意
此处所列的属性只是可用属性中的一部分。有关完整列表,请参阅 TreeNode。
节点文本,指定为字符向量或字符串标量。
图标源或文件,指定为字符向量、字符串标量或 m×n×3 真彩色图像数组。如果指定文件名,它可以是 MATLAB 路径中的图像文件名或图像文件的完整路径。如果您计划与他人共享某个 App,请将图像文件放在 MATLAB 路径中以便于打包 App。
支持的图像格式包括 JPEG、PNG、GIF、SVG 或 m×n×3 真彩色图像数组。有关真彩色图像数组的详细信息,请参阅在 MATLAB 中使用图像类型。
示例: 'icon.png' 指定 MATLAB 路径中的图标文件。
示例: 'C:\Documents\icon.png' 指定图像文件的完整路径。
节点数据,指定为任何类型的数组。指定 NodeData,以便在 App 代码中共享与节点相关的数据。
版本历史记录
在 R2017b 中推出
MATLAB Command
You clicked a link that corresponds to this MATLAB command:
Run the command by entering it in the MATLAB Command Window. Web browsers do not support MATLAB commands.
选择网站
选择网站以获取翻译的可用内容,以及查看当地活动和优惠。根据您的位置,我们建议您选择:。
您也可以从以下列表中选择网站:
如何获得最佳网站性能
选择中国网站(中文或英文)以获得最佳网站性能。其他 MathWorks 国家/地区网站并未针对您所在位置的访问进行优化。
美洲
- América Latina (Español)
- Canada (English)
- United States (English)
欧洲
- Belgium (English)
- Denmark (English)
- Deutschland (Deutsch)
- España (Español)
- Finland (English)
- France (Français)
- Ireland (English)
- Italia (Italiano)
- Luxembourg (English)
- Netherlands (English)
- Norway (English)
- Österreich (Deutsch)
- Portugal (English)
- Sweden (English)
- Switzerland
- United Kingdom (English)