Analyze Multiobjective Optimization Results
To analyze the multiobjective optimization results when there is more than one solution for a run, use the Pareto Graphs.
Pareto Graphs
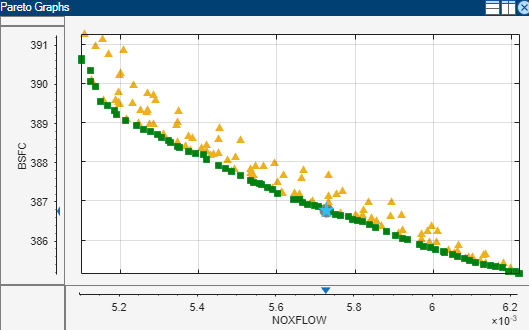
Pareto graphs show the available solutions for the selected run:
CAGE highlights the current selection with a gray circle outline.
Pareto solutions are green squares.
Dominated solutions are orange triangles.
Unsuccessful solutions are red circles (constraints may not be met or the algorithm ran out of time).
The selected solution is a star shape.
Click in the tables or graphs to view solutions. To change the selected solution, edit the number in the Selected solution box. CAGE displays the selected solution in the other graphs (objective and constraint).
Use the Pareto graphs with the table views (Solution Slice and Pareto Slice) and the other plots in the graphs (Objective Slice and Constraint Slice graphs) to help you select best solutions for each run. You can collect these solutions together in the Selected Solution Slice.
Tip
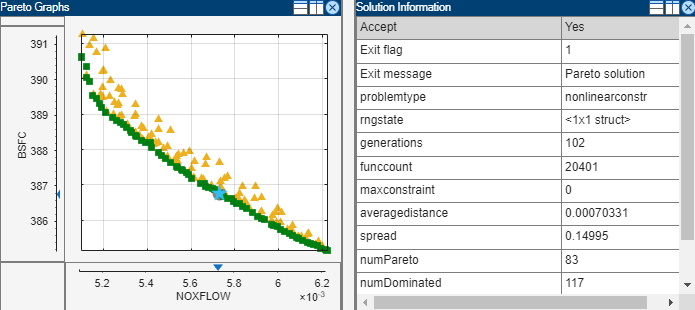
It is useful to display the Solution Information view at the same time to view information about a selected solution. You might want to select a dominated solution (orange triangle) over a pareto solution (green square) to trade off desired properties.
Before you run an NBI multiobjective optimization, you can specify
how many solutions you want the optimization to find by using the Optimization
Parameters dialog box. The NBI default number of solutions is 10 for two objectives.
Click Set Up and Run Optimization to change the number of
solutions before running again. In the Optimization Parameters dialog box, change how
many tradeoff solutions you want the optimization to find per run.
For gamultiobj, if CAGE does not find a feasible solution, you
might try increasing the default population size.
Multiobjective Output Messages
Multiobjective solutions can have specific exit messages.
To view the exit flag, hover over the accept status icon (green square, orange triangle, or red circle) for a run in the Optimization output view. You can view the algorithm exit messages for the currently selected run by selecting View > Current View > Solution Information. Check these messages to check for problems with your optimization.
| Message | Description | ||||||||||||
|---|---|---|---|---|---|---|---|---|---|---|---|---|---|
Multiobjective gamultiobj Output | See | ||||||||||||
Multiobjective NBI Output | CAGE displays shadow solutions at the start of the solution
list and indicated by the prefix “ NBI output messages
include the exit flags and the first part of the message returned by
|