Tools for Optimizations with Multiple Solutions
Analyzing Modal, MultiStart, and Multiobjective Optimizations
CAGE provides additional tools for analyzing optimizations with more than one solution for each operating point. Optimizations with multiple solutions are multiobjective optimizations, modal optimizations and multistart optimizations. The Optimization Output view defaults to a Selected Solution slice for multiple operating points; otherwise, it uses a Pareto slice for multiobjective or modal optimizations. Use these tools to view and select solutions:
Pareto Slice Table View — Shows a table of all solutions at one run.
Selected Solution Slice — Enables you to collect and export only the solutions you have decided are optimal for each run.
You can export selected solutions or all solutions to a data set, and you can restrict export to acceptable solutions only. See Exporting Selected Solutions.
Solution Information Table — Check the messages and exit flags for each solution.
For more information on the different optimization types and how to analyze solutions, refer to these pages:
Pareto Slice Table View
The Pareto Slice table view, ![]() , is designed for multiobjective, multistart or modal
optimizations that have more than one solution for each run. This view shows a table of all
solutions from a single run. You can scroll through the runs using the arrows or edit box at
the top.
, is designed for multiobjective, multistart or modal
optimizations that have more than one solution for each run. This view shows a table of all
solutions from a single run. You can scroll through the runs using the arrows or edit box at
the top.
To collect the best solutions across different runs, you must select a solution for each run. These selections are stored in the Selected Solution slice.
To select a solution for each run:
Decide which solution you want to use for the currently selected run.
Use the Pareto Slice table, Results contour and surface views, and the Objective Slice Graphs to select the best solution for the run. If you have constraints, use the Constraint Slice Graphs and Constraint Summary Table to help you decide which solution to choose for each run.
For multiobjective optimizations, display the Pareto Graphs, which shows the available solutions with the current selection highlighted as a light blue star. Right-click the view and select Current View > Pareto Graphs
For modal optimizations, see Analyze Modal Optimization Results.
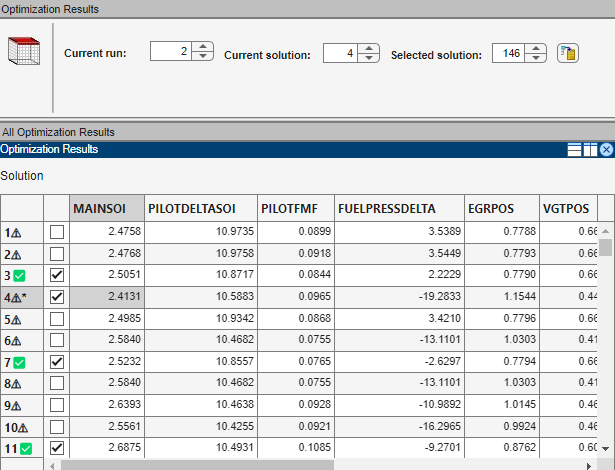
Once you decide which solution to use for the currently selected run, select the solution as best by editing the Selected solution control above the table, or by clicking Select Solution,
 , in the toolbar. You can also select best solutions using the
toolbar in the Optimization Results table, see All Optimization Results.
, in the toolbar. You can also select best solutions using the
toolbar in the Optimization Results table, see All Optimization Results.Scroll through the runs and select a best solution for each. These selections are collected in the Selected Solutions Slice, where you can view them, use them to fill tables, or export to a data set. You can also import them to an optimization. See Selected Solution Slice.
Before you run an NBI optimization you can specify how many solutions
you want the optimization to find, using the Set up options and run
optimization toolbar button.
In this table view, use the "Accept" check boxes to select rows within a single run. Each solution has a check box and colored icon indicating its "Acceptable" status. You can override these selections using the check boxes to choose solutions within a run for exporting to a data set, importing to other optimizations, or for future reference. See View Your Optimization Results.
Selected Solution Slice
In a multiobjective, modal, or multistart optimization, there is more than one possible optimal solution for each run. You can use the Selected Solution view to collect, view, and export those solutions you determine to be optimal for each run. For point optimizations, the Selected Solution view shows the solution and operating point on the RHS for the run selected on the LHS.
Click Selected Solution in the toolbar ![]() to view the Selected Solution
view.
to view the Selected Solution
view.
CAGE selects solutions based on the type of optimization.
For modal and multistart optimizations, CAGE automatically selects a solution for each run, which you can view and modify.
For multiobjective optimizations, CAGE chooses an average solution based on the set of Pareto solutions. You should manually select a solution to determine the acceptable tradeoff between competing objectives.
Note
You can either use the Selected Solution slice or choose to export all solutions to a data set. See Exporting Selected Solutions.
Use the plots and table views to help select the best solutions for each run. These chosen solutions are saved in the Selected Solution view. From there, you can export your chosen optimization output for each point to a data set, fill lookup tables, or import it into another optimization.
For multiobjective optimizations, the default selected solution is in the middle of the Pareto curve. For modal optimizations, it is the best mode, and for multistart optimizations, it is the best start.
Optionally, you can initialize the Selected Solution view with a specific solution for all runs. Select Solution > Selected Solution > Initialize.
The Initialize Selected Solution dialog box appears.
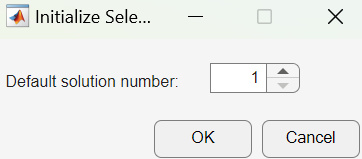
The default
1initializes the first solution for each run as the selected solution. You can edit the solution number here if you want. For example, if you select4, solution number4is initialized as the best solution for every run. Click OK.Use the table views and the plots in the graphs, such as the Objective Slice, Pareto graph, and Constraint Slice graphs to help select the best solution for each run. Use the procedure described in Pareto Slice Table View to select a solution for each run. Repeat until you have selected solutions for all runs.
You can also change the selected solution in the Selected Solution slice view, by editing the Selected solution control above the table, double clicking on the Pareto plot, or using the modal solution table. You should use the Pareto Slice table and other views to investigate all solutions.
These solutions are saved in the Selected Solutions
view. This view collects all your selected solutions in one place. For example, you might
select solution 7 for the first run and solution 6 for
the second, and so on. You can then use your chosen optimization output for each point to
fill lookup tables, see Fill Tables from Optimization Results, select the
Export to Data Set option, ![]() , from the toolbar and Solution
menu, see Exporting to a Data Set, or use these solutions as starting points in another
optimization, see Import from Output.
, from the toolbar and Solution
menu, see Exporting to a Data Set, or use these solutions as starting points in another
optimization, see Import from Output.
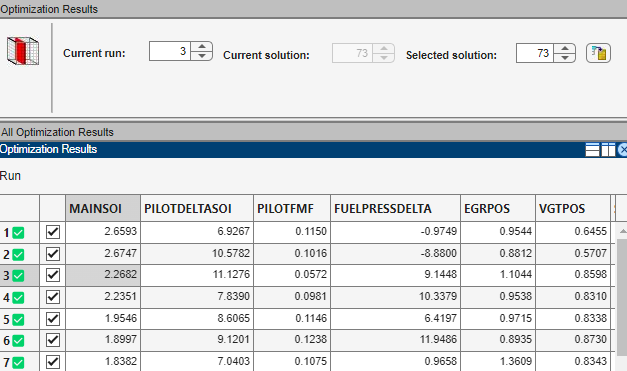
An example of the Selected Solution view is shown. It resembles the Solution Slice view, but the Selected solution control at the top is enabled instead of the Current solution control. You can change the selected solution in this view. The solution chosen as best for the currently selected run, in this or other views, appears in both current and selected solution edit boxes.
As in the other table views you can use the Accept check boxes to choose a selection of rows within the table. See View Your Optimization Results.
Exporting Selected Solutions
For optimizations with multiple solutions, such as multiobjective, modal, and multistart, you can export either selected solutions or all solutions to a data set. You can limit the export to acceptable solutions using the Accept check boxes. See View Your Optimization Results. You can use the Selected Solution slice to collect only the best solution for each run.
Select Solution > Export to Data Set or use the toolbar button. The Export to Data Set dialog box appears. For optimizations with multiple solutions this dialog box provides an additional control called Solutions to Export.
Use the Solutions to Export drop-down list to select either:
Selected Solutions— this exports your collected solutions in the Selected Solution Slice.All Solutions— this exports every solution from every run.You can choose whether to export acceptable solutions only with the check box Use acceptable solutions only.
For more information on exporting optimization results, see Exporting to a Data Set.