Fill Tables from Optimization Results
After analyzing your optimization results, you can fill lookup tables with the results selecting one of these approaches depending on whether the optimization is single or multiobjective and how the operating points relate to table inputs:
You can also export optimization results to a new or existing data set. See Exporting to a Data Set.
Lookup Table Filling from Optimization Results Wizard
In a single objective optimization, there is only one solution for each operating point, so you can fill lookup tables with your results. In a multiobjective optimization there is more than one solution per point, and you must first select the preferred solutions before you can use the Lookup Table Filling wizard. To collect your preferred solutions you must use the Selected Solution Slice, then you can use this wizard to fill lookup tables with the selected solutions. Modal and multistart optimizations also have multiple solutions per point but CAGE automatically selects solutions for you, so you do not have to select solutions before lookup table filling.
In the Optimization output view, you can use the Lookup Table Filling wizard as follows.
At the
Optimizationname_Output .
.The Lookup Table Filling wizard appears.
Note
If your tables have been filled before, CAGE remembers all your fill settings between optimization runs and saves the settings with the CAGE project.
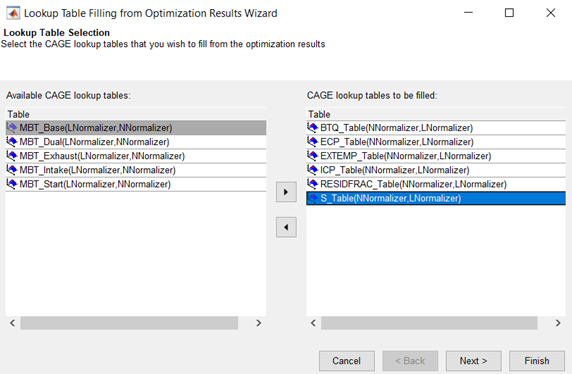
Select the tables to fill, and click the button to add them to the list of tables to be filled. Click Next.
Select or change filling factors for the tables.
CAGE automatically populates the filling factors for the tables if you created your tables using the Create Lookup Tables from Model wizard, and left the defaults to add all your new tables to a tradeoff.
View the Tradeoff column to see if a table is associated with a tradeoff. CAGE does not populate the fill factor if a table belongs to more than one tradeoff and there are different fill factors.
Note
If you create your tables using the Create Lookup Tables from Model wizard, you can add all your new tables to a tradeoff. The tradeoff can be useful for specifying fill factors for tables, and for investigating optimization results. See Create Lookup Tables from a Model.
If your tables are not in a tradeoff and you have not filled them before, select filling factors for your tables as follows:
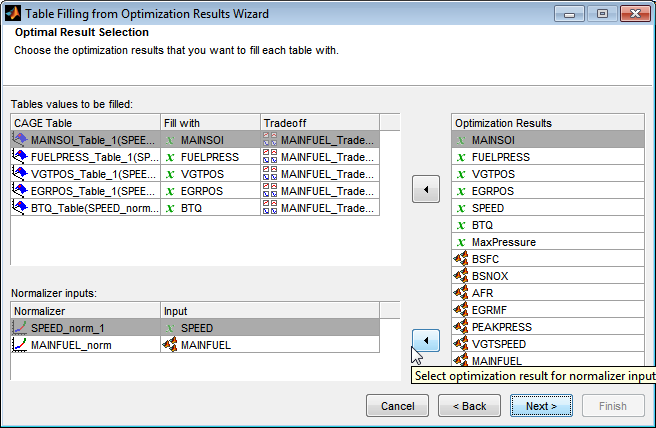
Select a CAGE table to be filled in the Table values to be filled list.
Select the correct variable or model output from the list of Optimization Results and click the button to match the result to the table.
Your selected filling factor appears in the Fill with column.
Repeat for other tables.
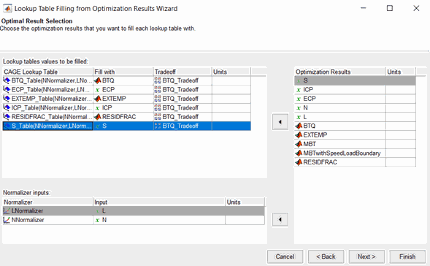
Verify the Normalizer inputs show the correct inputs. You might need to specify the Normalizer inputs to match with optimization results, if you are filling tables with different inputs to your optimization operating points. See Lookup Table Filling When Optimization Operating Point Inputs Differ from Table Inputs.
Click Next.
Select a Fill Method.
Extrapolate Fill— Uses the optimization results to fill the whole table by extrapolation.Direct Fill— Fills only those table cells whose breakpoints exactly match the optimization points.Clip Fill (column-based)— Fills table with direct optimization results. Clips the boundary results along the table column.Clip Fill (row-based)— Fills table with direct optimization results. Clips the boundary results along the table row.Custom Fill— You can write your own table filling algorithm and use the file browser to select it. See Custom Fill Function Structure.
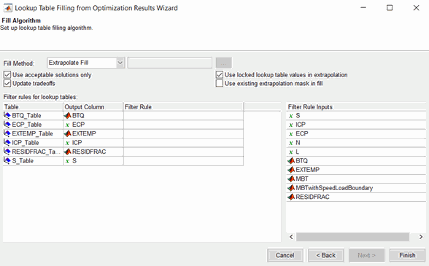
Use acceptable solutions only — Leave this check box selected to use only optimization results marked as 'acceptable'. See View Your Optimization Results.
Update tradeoffs — Select this check box to update tradeoffs with the optimal values from your optimization. You must update your tradeoff to populate it with optimization results. If you do not update the tradeoff, table values and tradeoff values do not match.
For best results, you need a table for each model input (free and fixed, except normalizer variables) to fill simultaneously from the optimization results. You can automatically create a tradeoff with all these tables by using the Create Tables from Model wizard. Evaluation of models in tradeoff uses the variable set points for any variables that do not have a tradeoff table.
Use the two check boxes on the right to incrementally fill lookup tables from the results of multiple optimizations with smooth interpolation through existing table values. CAGE can extrapolate the optimization results to pass smoothly through table masks and locked cells. Use these features when you want to use separate optimizations to fill different regions of a lookup table.
Use locked table values in extrapolation— When this check box is selected, CAGE smoothly fills the table between fixed table values and optimization results.
If your calibration tables have fixed values for some table cells, use locked cells for the table cells with fixed values. Such cells often appear on the edge of a table.
Use existing extrapolation mask in fill— When this check box is selected, CAGE smoothly fills the table between the values in the mask (from previous lookup table filling) and the current optimization results.
Select this check box when you want to fill the same table from multiple optimizations that provide solutions at different operating points. Complex calibration problems can require different optimizations for different regions of a table. The toolbox automatically adds filled cells to the table mask.
If you use the wizard to repeatedly fill a table, CAGE adds to any existing extrapolation mask. As an example, consider filling multiple zones of a table using results from different optimizations. All zones are cumulatively added to the mask. If there is overlap with previous fills, cells are overwritten unless they are locked. Locked cells are never altered by lookup table filling.
(Optional) Specify Filter Rules to select part of the optimization results for lookup table filling. Specify a filter rule with a logical expression using any input or model available for use in lookup table filling. You can specify an operating mode (for modal optimizations) or any valid expression as a filter. For an example, see Filling Tables for Operating Modes.
Click Finish to fill the tables.
A dialog box shows which tables have been successfully filled. Switch to the Tables view to examine the tables.
Note
Lookup tables automatically update after an optimization is rerun.
Lookup Table Filling When Optimization Operating Point Inputs Differ from Table Inputs
For some optimization problems, you want to optimize at operating points in different variables to the tables you want to fill, and use response models as normalizer inputs to tables. For example, your problem requires running an optimization at torque and speed operating points, but you want to fill lookup tables on axes of mainfuel (a response model) and speed. If all the response model input variables are in your optimization, you can fill tables with that response model as a normalizer input.
Create your tables using the Create Lookup Tables from Model wizard, and select a response model as an input to your tables. For example, using the example project
DieselPointByPoint.cagin thembctrainingfolder, create tables from theMAINFUELmodel, and selectMAINFUELas the Y-axis normalizer input, as shown.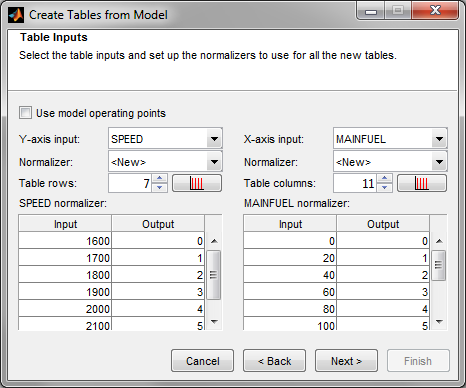
You must specify the breakpoints for your model input normalizer. Edit breakpoints by clicking the button after Table columns, and enter a number of points and the range to space the breakpoints over. If you do not do this, model inputs are spaced over 0-1, because CAGE cannot determine the range automatically as happens with variables. After you create your tables with a model input, in the Variable Dictionary you can view a new variable named
modelname_inputWhen you are ready to fill lookup tables with optimization results, open the Lookup Table Filling from Optimization Results Wizard, select your tables with the response model normalizer input, e.g.,
MAINFUEL_norm, and click Next.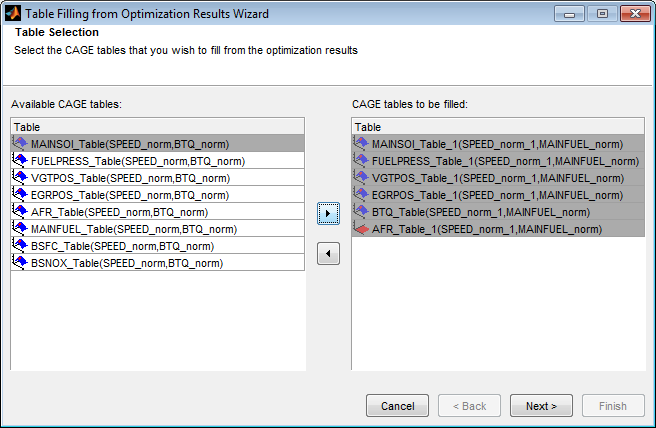
On the Optimal Result Selection screen, CAGE looks for matches by name among the variables and response models in the Optimization Results list. Verify the Normalizer Input column shows the input you want. If CAGE cannot find a match, the Input column is empty. To select or change an input, select an item in the Optimization Results list and click the button to select the optimization result for normalizer input.
Click Next and Finish to fill your tables.
Filling Tables Via Data Sets
The alternative method of filling tables with optimization output uses Data Sets. This can be useful to see the optimization results and the filled table surface on the same plot. In Data Sets you can also manually edit the results before filling, and compare results with external data.
From the optimization
Outputnode, click (Export to Data Set) in the toolbar (or select Solution > Export to Data Set). The Export to Data Set dialog box appears. See Exporting to a Data Set for instructions.
Go to the Data Sets view (click the Data Sets button in the Data Objects pane) to see that the table of optimization results is contained in the new data set.
You can now use this data set (or any optimization results) to fill lookup tables, as you can with any data set.
Select the data set and click
 (Fill Table from Data Set) in the toolbar.
Clear the check box to Show table history after fill.
Choose to fill a table with the desired optimization output by selecting them in the two lists, then click the button Fill Table at the bottom right.
Right-click the display and select Surface to see the filled table surface and the optimization output values.
See also Fill Lookup Tables from Data for an example showing how to use data sets to fill lookup tables.
Custom Fill Function Structure
It is useful to create your own function to fill lookup tables from the results of an optimization, for example, to implement alternative fill methods, smoothing strategies, or to customize output.
The input/output structure of a custom fill function resembles that of the MATLAB® interpolation routines INTERP1 and INTERP2. To see the structure of the function, it is best to look at an example:
Locate and open the file
griddataTableFill.min thembctrainingfolder.Type this at the command line to open the example:
edit griddataTableFill
All 2-D custom fill functions must take these six inputs:
| Input | Description |
|---|---|
| Column coordinate of optimization results |
| Row coordinate of optimization results
|
| Optimized results at (row, col) points
|
| Column breakpoints of table to be filled
|
| Row breakpoints of table to be filled
|
| Existing table values of table to be filled
|
The function must pass three output arguments back to CAGE, to allow CAGE to fill the table:
| Output | Description |
|---|---|
ok | Boolean flag to indicate success of the table fill (TRUE
or FALSE) |
tabval | New table values of table to be filled
(NROW-by-NCOL) |
fillmask | Logical matrix to indicate cells to be added to the extrapolation mask as a
consequence of the table being filled (NROW-by-NCOL) |
In the above specifications:
NFis the number of points from the optimization results that are used to fill your tables.NCOLis the number of column breakpoints in the table.NROWis the number of row breakpoints in the table.
Your function should handle the cases when the table fill is successful or
not. In griddataTableFill, this is handled using the try-catch construct
around the call to griddata. If griddata should fail,
then the ok flag is set to false and the function returns.
Custom Fill Function for 1–D Tables
You can also write custom fill functions to fill 1–D tables. In this case the input and output specifications are as follows:
| Input | Description |
|---|---|
row | Row coordinate of optimization results (NF-by-1) |
filldata | Optimized results at (row, col) points (NF-by-1) |
rowaxis | Row breakpoints of table to be filled
(NROW-by-1) |
currtabdata | Existing table values of table to be filled
(NROW-by-1) |
| Output | Description |
|---|---|
ok | Boolean flag to indicate success of the table fill (TRUE
or FALSE) |
tabval | New table values of table to be filled
(NROW-by-1) |
fillmask | Logical matrix to indicate cells to be added to the extrapolation mask as a
consequence of the table being filled (NROW-by-1) |
Exporting to a Data Set
You can export the optimization output results to new or existing data sets.
To export to a data set:
Select Solution > Export to Data Set or use the toolbar button. The Export to Data Set dialog box appears.
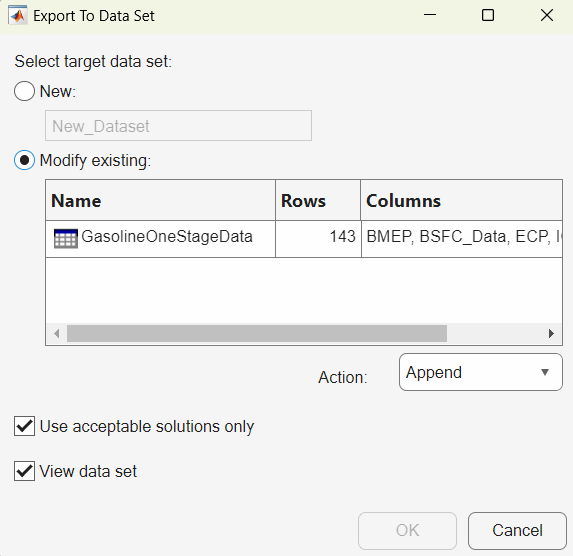
If exporting to a New data set (the default), you can edit the name in the edit box.
If you want to overwrite or add to an existing data set:
Click the option button Modify existing.
Select the desired data set in the list.
Choose from Action list:
Appendadds the data to the chosen data set.Overwritereplaces all data in the data set with the new data.
By default, the check box Use acceptable solutions only is selected. Optimization results with selected Accept check boxes are exported. Clear the Use acceptable solutions only check box if you want to export all the optimization results.
Click OK and the data is exported to the data set.
This table summarizes the export rules.
Export rules | All fixed and optimization variables are exported where possible. |
No models are exported to the data set. If you want to evaluate a model at the variable values, add the model to the data set in the Data Sets view. | |
When appending, the rules are the same as when merging data sets:
|