Visualize 3-D Medical Image Data Using Medical Image Labeler
This example shows how to interactively explore medical image volumes and export snapshots and animations from the Medical Image Labeler app.
Download Data
This example labels chest CT data from a subset of the Medical Segmentation Decathlon data set [1]. Download the MedicalVolumNIfTIData.zip file from the MathWorks® website, then unzip the file. The size of the subset of data is approximately 76 MB.
zipFile = matlab.internal.examples.downloadSupportFile("medical","MedicalVolumeNIfTIData.zip");
filepath = fileparts(zipFile);
unzip(zipFile,filepath)
After you download the data, the dataFolder folder contains the downloaded and unzipped data.
dataFolder = fullfile(filepath,"MedicalVolumeNIfTIData");Open Medical Image Labeler
Open the Medical Image Labeler app from the Apps tab on the MATLAB® toolstrip, under Image Processing and Computer Vision. You can also open the app by using the medicalImageLabeler command.
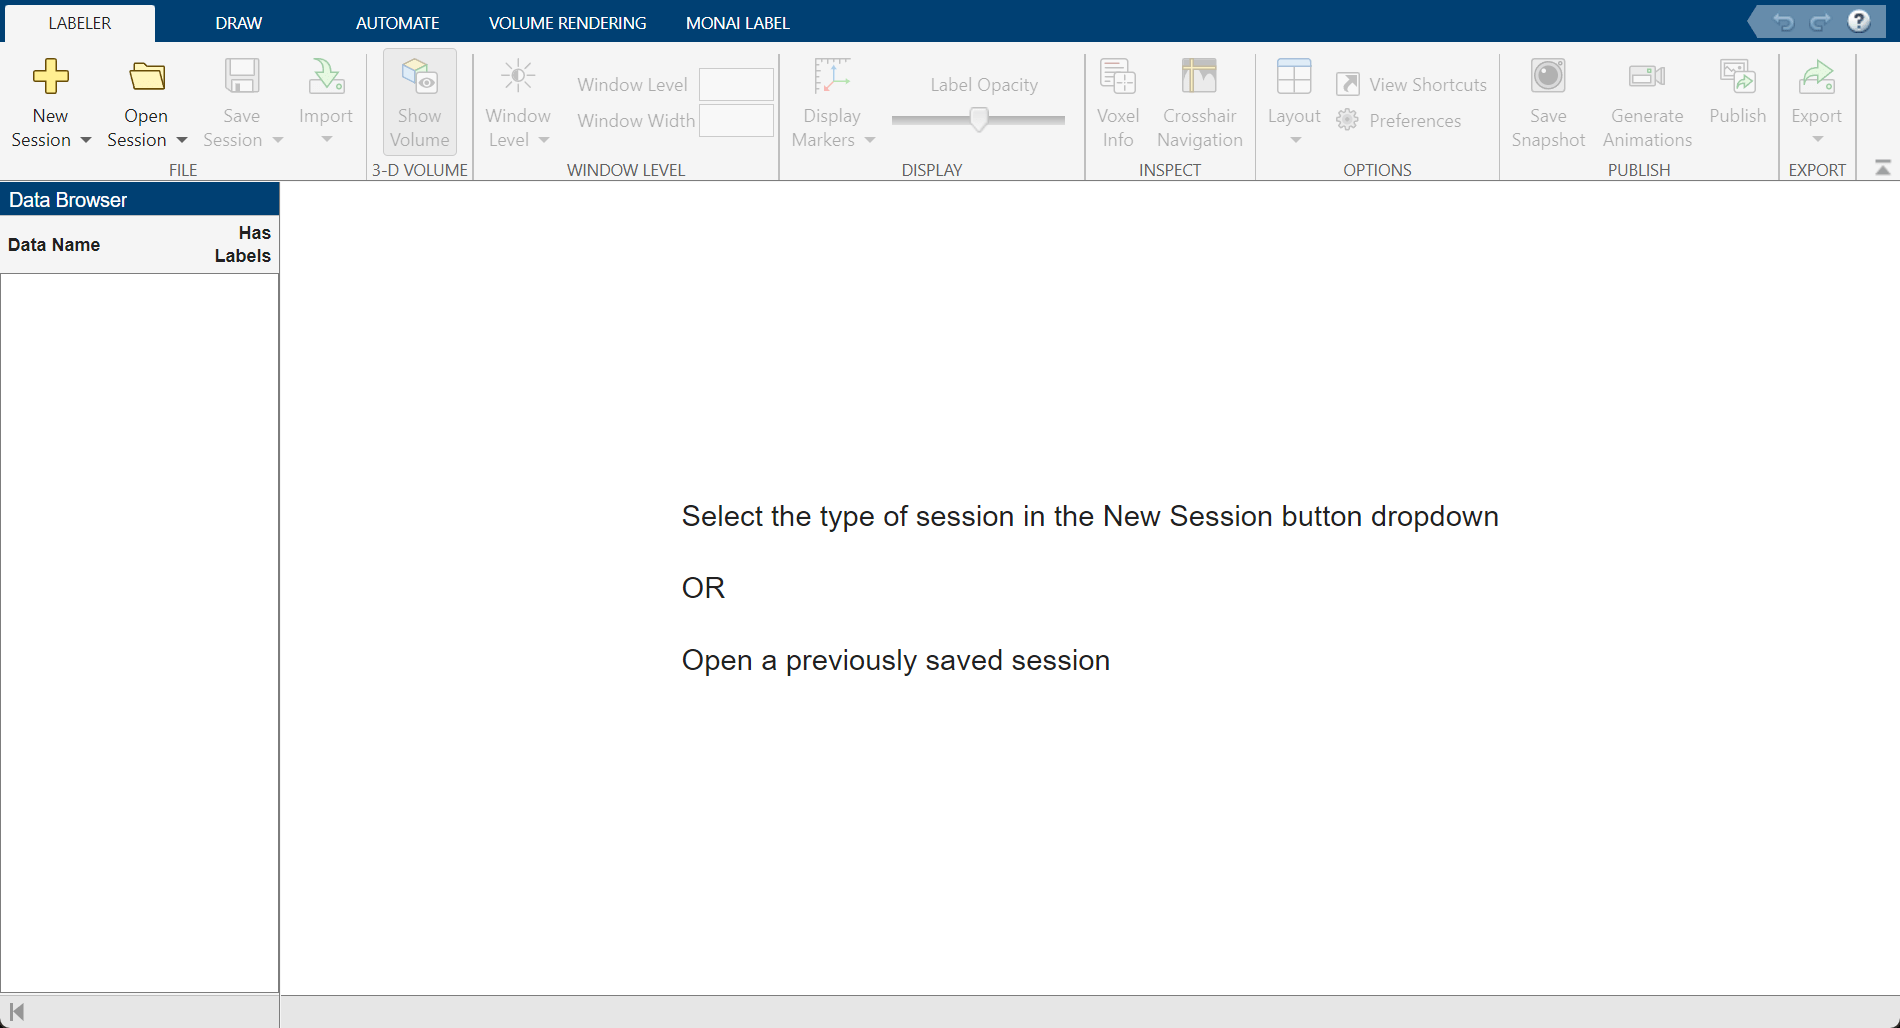
Create New Volume Labeling Session
To start a new 3-D session, on the app toolstrip, click New Session and select New Volume session (3-D). In the Create a new session folder dialog box, specify a location in which to save the new session folder by entering a path or selecting Browse and navigating to your desired location. In the New Session Folder box, specify a name for the folder for this app session. Select Create Session.
Load Image Data into Medical Image Labeler
To load an image into the Medical Image Labeler app, on the app toolstrip, click Import. Then, under Data, select From File. Browse to the location where you downloaded the data. You can find the data location by checking the dataFolder value in the workspace. Once you browse to the download location, select the file lung_027.nii.gz and click Open to import the file. For a Volume Session, the imported data file can be a single DICOM or NIfTI file containing a 3-D image volume, or a directory containing multiple DICOM files corresponding to a single image volume.
The name of the imported file is visible in the Data Browser pane.
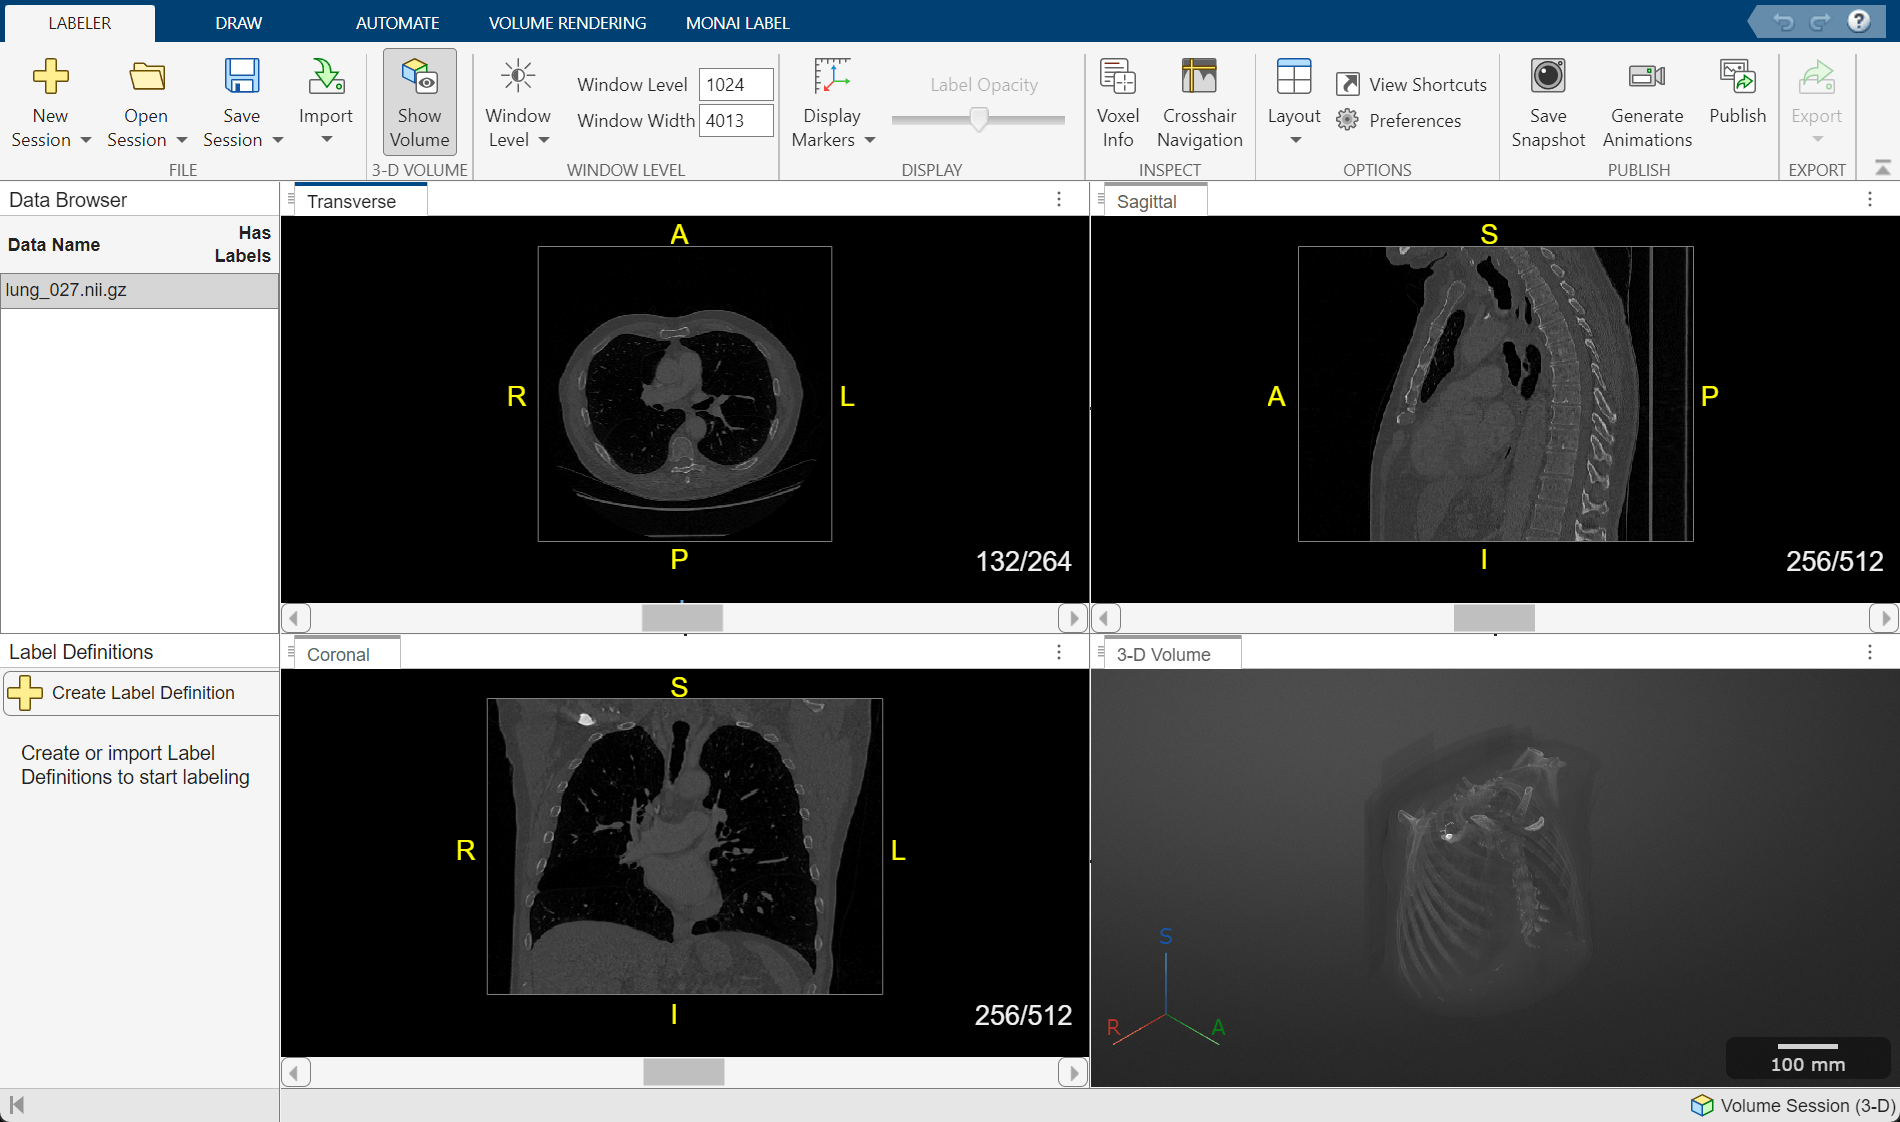
View Data as Anatomical Slice Planes
The app displays the data as anatomical slice planes in the Transverse, Sagittal, and Coronal panes.
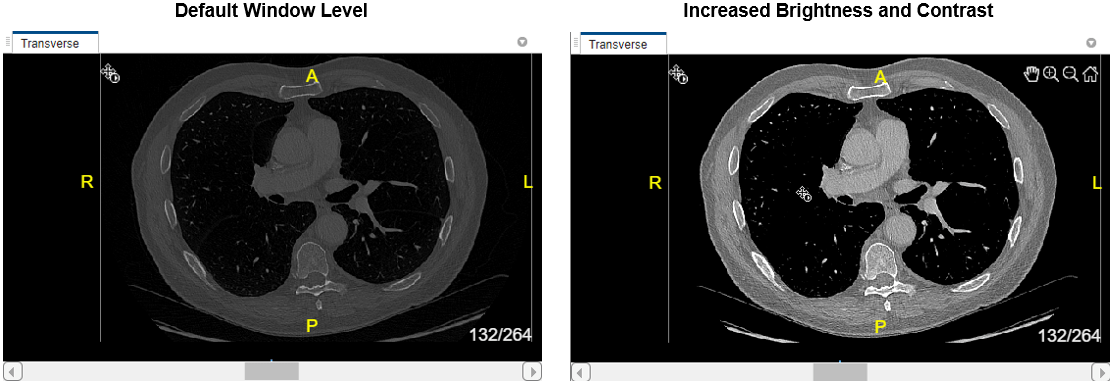
By default, the app displays the center slice in each slice plane. You can change the displayed slice by using the scroll bar at the bottom of a slice pane, or you can click the pane and then press the left and right arrow keys. The app displays the current slice number out of the total number of slices, such as 132/264, for each slice pane. The app also displays anatomical display markers indicating the anterior (A), posterior (P), left (L), right (R), superior (S), and inferior (I) directions. To toggle the visibility of the display markers, on the app toolstrip, click Display Markers and, under 2-D Slices, select or clear 2D Orientation Markers. You can zoom in on the current slice pane using the mouse scroll wheel or the zoom controls that appear when you pause on the slice pane.
By default, the app displays the scan using the Radiological display convention, with the left side of the patient on the right side of the image. To display the left side of the patient on the left side of the image, on the app toolstrip, click Preferences, and in the dialog box that opens, change the Display Convention to Neurological.
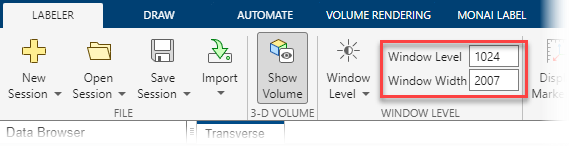
To change the brightness or contrast of the display, adjust the display window. Changing the display window does not modify the underlying image data. To update the display window, you can directly edit the values in the Window Level and Window Width boxes in the app toolstrip.
Alternatively, adjust the window using the Window Level tool. First, select ![]() in the app toolstrip. Then, click and hold in any of the slice panes, and drag up and down to increase and decrease the brightness, respectively, or left and right to increase and decrease the contrast. The Window Level and Window Width values in the toolstrip automatically update as you drag. Clear
in the app toolstrip. Then, click and hold in any of the slice panes, and drag up and down to increase and decrease the brightness, respectively, or left and right to increase and decrease the contrast. The Window Level and Window Width values in the toolstrip automatically update as you drag. Clear ![]() to deactivate the tool. To reset the brightness and contrast, click Window Level
to deactivate the tool. To reset the brightness and contrast, click Window Level 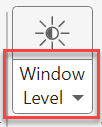 and select Reset. You can swap the mouse actions, such that dragging vertically changes the contrast and dragging horizontally changes the brightness, in the Preferences dialog box.
View Data as 3-D Volume
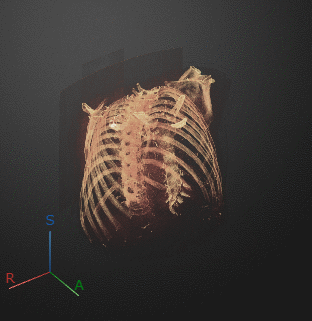
The app displays the data as a 3-D volume in the 3-D Volume pane. You can toggle the visibility of the volume display using the Show Volume button on the Labeler tab of the app toolstrip.
In the 3-D Volume pane, click and drag to rotate the volume or use the scroll wheel to zoom. You can adjust the volume display using the tools in the Volume Rendering tab of the app toolstrip. To change the background color, click Background Color. Toggle the use of a background gradient by clicking Use Gradient. To change the gradient color, with Use Gradient selected, click Gradient Color. To restore the default background settings, click Restore Background. You can also view orientation axes and scale bar display markers in the 3-D Volume pane. To toggle the visibility of each display marker, on the Labeler tab of the app toolstrip, click Display Markers, and under 3-D Volume, select or clear 3D Orientation Axes and Scale Bars.

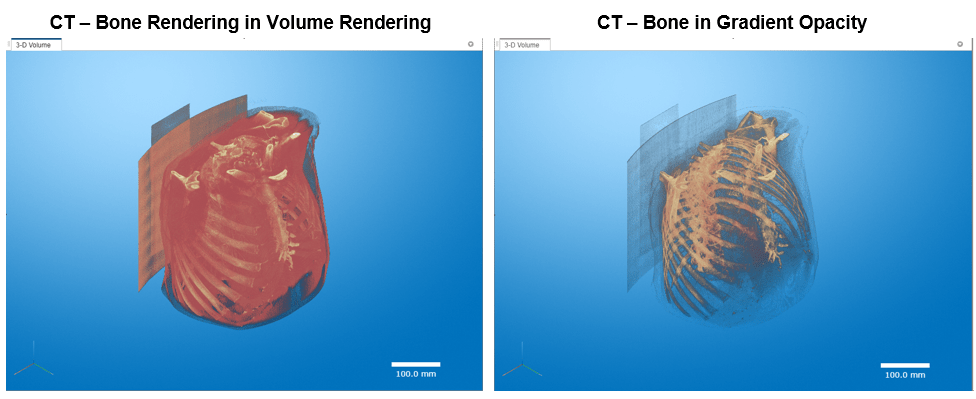
You can change how the app displays voxel intensity data by selecting one of several built-in rendering styles. On the Volume Rendering tab, select CT - Bone from the Rendering Presets gallery to use an alphamap and colormap recommended for highlighting bone tissue in computed tomography (CT) scans. To refine the built-in displays for your data set, adjust the display parameters by using the Rendering Editor. To open the editor, on the Volume Rendering tab of the app toolstrip, click Rendering Editor.

Using the Rendering Editor, you can manually adjust the rendering technique, the transparency alphamap, and the colormap of the 3-D volume rendering. The app supports these rendering techniques:
Volume Rendering — View the volume based on the specified color and transparency for each voxel.
Maximum Intensity Projection — View the voxel with the highest intensity value for each ray projected through the data.
Gradient Opacity — View the volume based on the specified color and transparency, with an additional transparency applied if the voxel is similar in intensity to the previous voxel along the viewing ray.
When you render a volume with uniform intensity using Gradient Opacity, the internal portion of the volume appears more transparent than in the Volume Rendering rendering style, enabling better visualization of label data, if present, and intensity gradients in the volume. For this example, select Gradient Opacity.
You can refine the alphamap and colormap by manipulating the plots and colorbar in the Rendering Editor directly. To save your customized settings, in the Volume Rendering tab of the app toolstrip, click Save Rendering. The app adds an icon for your custom settings to the gallery in the app toolstrip, under User-Defined. If you have multiple files loaded in the app session, you can apply the same built-in or custom rendering settings to all volumes by clicking Apply To All Volumes in the app toolstrip.
Export Snapshot Image from App
You can export images from the Medical Image Labeler app to use for figures. In the Labeler tab of the app toolstrip, click Save Snapshot. In the Save Snapshot dialog box, select the views you want to export and click Save. By default, the app saves a snapshot for the transverse, coronal, and sagittal slice planes, as well as the 3-D volume window. In the second dialog box, specify the location where you want to save the images, and click Save again. Each snapshot is saved as a separate PNG file. The 2-D snapshots match the current brightness and contrast settings of the app, but show the full slice without any zooming or anatomical display markers. The 3-D snapshot matches the current rotation and zoom values in the 3-D Volume pane, and contains any enabled display markers.
Export Animations from App
You can generate 2-D animations that scroll through transverse, sagittal, or coronal slices, or 3-D animations of the volume rotating about a specified axis. Access the animation generator tool in the Labeler tab of the app toolstrip by clicking Generate Animations.
To export a 2-D animation, in the Animation editor, select 2-D slices. In the Direction section, specify the Slice Direction along which you want to view slices. Use the settings in the Animation section to customize the Slice Range and Step Size. Select Append animation in reverse to make the animation scroll forward and then backward through the slides, rather than forward only. In the Export section, specify the Loop Count and Animation Length. Specify the loop count as a positive integer, for a fixed number of loops, or as inf to create a continuously looping animation. Specify the animation length in seconds. The editor displays the speed in frames per second based on your specified slice range and animation length. The settings in this image create an animation that captures every eighth slice along the transverse direction. Each loop animates forward and then in reverse through the slice range. The animation loops infinitely, with a length of 10 seconds per loop, and a frame rate of 6.475 FPS.
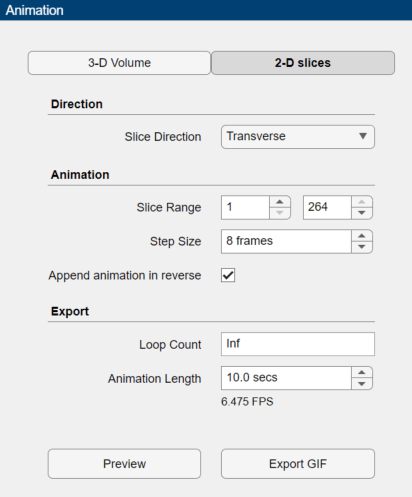
Click Preview to preview one loop of the animation with the specified Direction and Animation settings. The preview does not reflect the loop count or animation length of the exported GIF. The preview plays in the slice view of the selected slice direction. If you are satisfied with the preview, click Export GIF, and, in the dialog box, select the location to save the animation GIF file. You can open and view the GIF file from the saved location and share the animation outside of MATLAB.
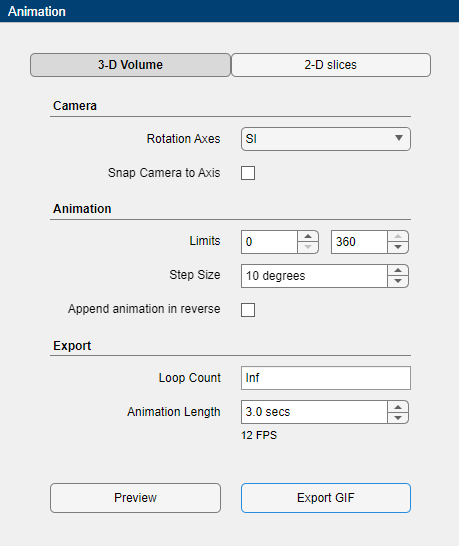
To export a 3-D animation, in the Animation editor, select 3-D Volume. Under Camera, select the Rotation Axis to rotate around as SI (superior-inferior), LR (left-right), AP (anterior-posterior), or the current up vector in the 3-D Volume pane. Select Snap Camera to Axis to set the camera location to view the volume head-on versus maintaining the rotation in the 3-D Volume pane. In the Animation section, use Limits to specify the orientations, in degrees, between which to rotate the volume. Specify the Step Size in degrees. The settings in this image create an animation of the volume rotating about the superior-inferior axis, with frames acquired every ten degrees of rotation. The animation loops infinitely, with a length of 3 seconds per loop.
Click Preview to preview one loop of the animation with the specified Camera and Animation settings. The preview does not reflect the loop count or animation length of the exported GIF. The preview plays in the 3-D Volume pane. If you are satisfied with the preview, click Export GIF, and, in the dialog box, select the location to save the animation GIF file. You can open and view the GIF file from the saved location and share the animation outside of MATLAB.
References
[1] Medical Segmentation Decathlon. "Lung." Tasks. Accessed May 10, 2018. http://medicaldecathlon.com. The Lung data set is provided by the Medical Segmentation Decathlon under the CC-BY-SA 4.0 license. All warranties and representations are disclaimed. See the license for details. This example uses a subset of the original data set consisting of two CT volumes.
See Also
Medical Image
Labeler | sliceViewer | volshow | montage