plot
Display laser or lidar scan readings
Description
plot(___,Name,Value) provides additional options
specified by one or more Name,Value pair arguments.
linehandle = plot(___)linehandle to modify properties of the
line series after it is created.
Examples
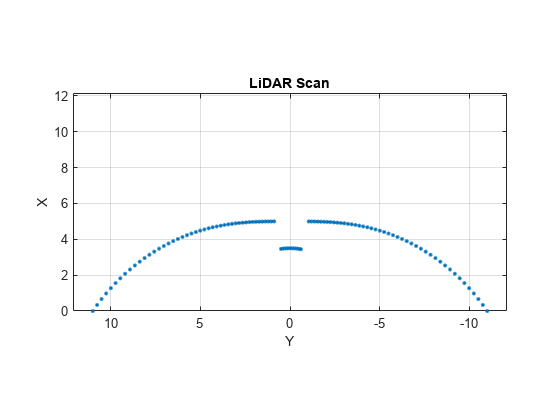
Specify lidar data as vectors of ranges and angles. These values include readings outside of the sensors range.
x = linspace(-2,2);
ranges = abs((1.5).*x.^2 + 5);
ranges(45:55) = 3.5;
angles = linspace(-pi/2,pi/2,numel(ranges));
Create a lidar scan by specifying the ranges and angles. Plot all points of the lidar scan.
scan = lidarScan(ranges,angles);
plot(scan)
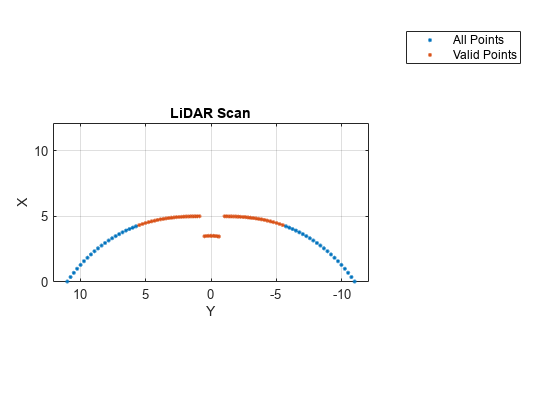
Remove invalid points based on a specified minimum and maximum range.
minRange = 0.1;
maxRange = 7;
scan2 = removeInvalidData(scan,'RangeLimits',[minRange maxRange]);
hold on
plot(scan2)
legend('All Points','Valid Points')
Input Arguments
Name-Value Arguments
Outputs
Version History
Introduced in R2015a