append
Add states to end of path
Syntax
Description
Examples
Create a navPath object based on multiple waypoints in a Dubins space.
dubinsSpace = stateSpaceDubins([0 25; 0 25; -pi pi])
dubinsSpace =
  stateSpaceDubins with properties:

   SE2 Properties
                 Name: 'SE2 Dubins'
          StateBounds: [3×2 double]
    NumStateVariables: 3

   Dubins Vehicle Properties
     MinTurningRadius: 1
pathobj = navPath(dubinsSpace)
pathobj =
  navPath with properties:

      StateSpace: [1×1 stateSpaceDubins]
          States: [0×3 double]
       NumStates: 0
    MaxNumStates: Inf
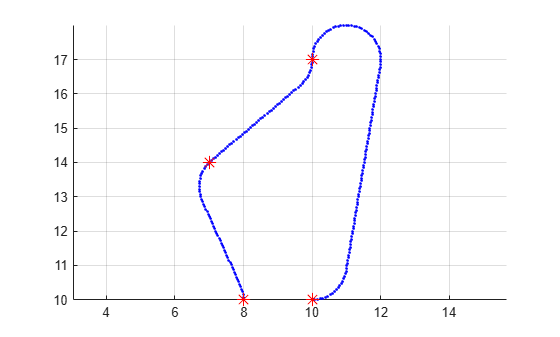
waypoints = [8 10 pi/2;
             7 14 pi/4;
             10 17 pi/2;
             10 10 -pi];
append(pathobj,waypoints)
Interpolate that path so that it contains exactly 250 points.
interpolate(pathobj,250)
Visualize the interpolated path and the original waypoints.
figure
grid on
axis equal
hold on
plot(pathobj.States(:,1),pathobj.States(:,2),".b")
plot(waypoints(:,1),waypoints(:,2),"*r","MarkerSize",10)
Calculate length of path.
len = pathLength(pathobj);
disp("Path length = " + num2str(len))
Path length = 19.4722
Load a 3-D occupancy map of a city block into the workspace. Specify the threshold to consider cells as obstacle-free.
mapData = load("dMapCityBlock.mat");
omap = mapData.omap;
omap.FreeThreshold = 0.5;
Inflate the occupancy map to add a buffer zone for safe operation around the obstacles.
inflate(omap,1)
Create an SE(3) state space object with bounds for state variables.
ss = stateSpaceSE3([0 220;0 220;0 100;inf inf;inf inf;inf inf;inf inf]);
Create a navPath object based on multiple waypoints in an SE(3) state space.
path = navPath(ss);
waypoints = [40 180 15 0.7 0.2 0 0.1;
             55 120 20 0.6 0.2 0 0.1;
             100 100 25 0.5 0.2 0 0.1;
             130 90 30 0.4 0 0.1 0.6;
             150 33 35 0.3 0 0.1 0.6];
append(path,waypoints)
Interpolate that path so that it contains exactly 250 points.
interpolate(path,250)
Visualize the interpolated path and the original waypoints.
show(omap)
axis equal
view([-10 55])
hold on
% Start state
scatter3(waypoints(1,1),waypoints(1,2),waypoints(1,3),"g","filled")
% Goal state
scatter3(waypoints(end,1),waypoints(end,2),waypoints(end,3),"r","filled")
% Intermediate waypoints
scatter3(waypoints(2:end-1,1),waypoints(2:end-1,2), ...
         waypoints(2:end-1,3),"y","filled")
% Path
plot3(path.States(:,1),path.States(:,2),path.States(:,3), ...
      "r-",LineWidth=2)
![Figure contains an axes object. The axes object with title Occupancy Map, xlabel X [meters], ylabel Y [meters] contains 5 objects of type patch, scatter, line.](../../examples/nav/win64/CreateNavPathBasedOnMultipleWaypointsInSE3StateSpaceExample_01.png)
Calculate length of path.
len = pathLength(path);
disp("Path length = " + num2str(len))
Path length = 204.1797
Input Arguments
Extended Capabilities
Version History
Introduced in R2019b