isPathValid
Determine if planned path is obstacle free
Description
isPathValid( returns either a
logical pathMetricsObj)1 (true) if the planned path is obstacle free or a logical
0 (false) if the path is invalid.
Examples
Compute smoothness, clearance, and validity of a planned path based on a set of poses and the associated map environment.
Load and Assign Map to State Validator
Create an occupancy map from an example map and set the map resolution.
load exampleMaps.mat; % simpleMap
mapResolution = 1; % cells/meter
map = occupancyMap(simpleMap,mapResolution);
Create a Dubins state space.
statespace = stateSpaceDubins;
Create a state validator based on occupancy map to store the parameters and states in the Dubins state space.
statevalidator = validatorOccupancyMap(statespace);
Assign the map to the validator.
statevalidator.Map = map;
Set the validation distance for the validator.
statevalidator.ValidationDistance = 0.01;
Update the state space bounds to be the same as the map limits.
statespace.StateBounds = [map.XWorldLimits;map.YWorldLimits;[-pi pi]];
Plan Path
Create an RRT* path planner and allow further optimization.
planner = plannerRRTStar(statespace,statevalidator);
planner.ContinueAfterGoalReached = true;
Reduce the maximum number of iterations and increase the maximum connection distance.
planner.MaxIterations = 2500;
planner.MaxConnectionDistance = 0.3;
Define start and goal states for the path planner as [x, y, theta] vectors. x and y are the Cartesian coordinates, and theta is the orientation angle.
start = [2.5, 2.5, 0]; % [meters, meters, radians]
goal = [22.5, 8.75, 0];
Plan a path from the start state to the goal state. The plan function returns a navPath object.
rng(100,'twister') % repeatable result
[path,solutionInfo] = plan(planner,start,goal);
Compute and Visualize Path Metrics
Create a path metrics object.
pathMetricsObj = pathmetrics(path,statevalidator);
Check path validity. The result is 1 (true) if the planned path is obstacle free. 0 (false) indicates an invalid path.
isPathValid(pathMetricsObj)
ans = logical
   1
Calculate the minimum clearance of the path.
clearance(pathMetricsObj)
ans =
1.4142
Evaluate the smoothness of the path. Values close to 0 indicate a smoother path. Straight-line paths return a value of 0.
smoothness(pathMetricsObj)
ans =
1.7318
Visualize the minimum clearance of the path.
show(pathMetricsObj)
legend('Planned Path','Minimum Clearance')
![Figure contains an axes object. The axes object with xlabel X [meters], ylabel Y [meters] contains 5 objects of type image, line, patch. These objects represent Planned Path, Minimum Clearance.](../../examples/nav/win64/ComputePathMetricsExample_01.png)
Plan a vehicle path through a parking lot using the RRT* algorithm. Compute and visualize the smoothness, clearance, and validity of the planned path.
Load and Assign Map to State Validator
Load a costmap of a parking lot. Plot the costmap to see the parking lot and the inflated areas that the vehicle should avoid.
load parkingLotCostmap.mat;
costmap = parkingLotCostmap;
plot(costmap)
xlabel('X (meters)')
ylabel('Y (meters)')
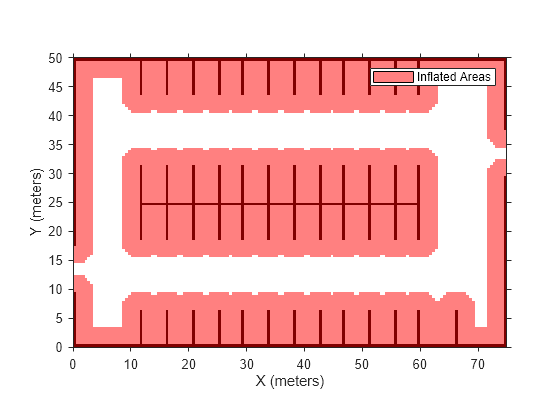
Create a stateSpaceDubins object and increase the minimum turing radius to 4 meters.
statespace = stateSpaceDubins;
statespace.MinTurningRadius = 4; % meters
Create a validatorVehicleCostmap object using the created state space.
statevalidator = validatorVehicleCostmap(statespace);
Assign the parking lot costmap to the state validator object.
statevalidator.Map = costmap;
Plan Path
Define start and goal poses for the vehicle as [x, y, Θ] vectors. World units for the (x,y) locations are in meters. World units for the orientation angles Θ are in degrees.
startPose = [5, 5, 90]; % [meters, meters, degrees]
goalPose = [40, 38, 180]; % [meters, meters, degrees]
Use a pathPlannerRRT (Automated Driving Toolbox) object and the plan (Automated Driving Toolbox) function to plan the vehicle path from the start pose to the goal pose.
planner = pathPlannerRRT(costmap);
refPath = plan(planner,startPose,goalPose);
Interpolate along the path at every one meter. Convert the orientation angles from degrees to radians.
poses = zeros(size(refPath.PathSegments,2)+1,3);
poses(1,:) = refPath.StartPose;
for i = 1:size(refPath.PathSegments,2)
    poses(i+1,:) = refPath.PathSegments(i).GoalPose;
end
poses(:,3) = deg2rad(poses(:,3));
Create a navPath object using the Dubins state space object and the states specified by poses.
path = navPath(statespace,poses);
Compute and Visualize Path Metrics
Create a pathmetrics object.
pathMetricsObj = pathmetrics(path,statevalidator);
Check path validity. The result is 1 (true) if the planned path is obstacle free. 0 (false) indicates an invalid path.
isPathValid(pathMetricsObj)
ans = logical
   1
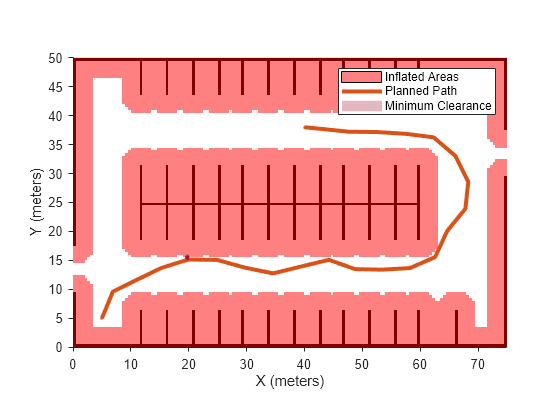
Compute and visualize the minimum clearance of the path.
clearance(pathMetricsObj)
ans =
0.5000
show(pathMetricsObj)
legend('Inflated Areas','Planned Path','Minimum Clearance')
xlabel('X (meters)')
ylabel('Y (meters)')
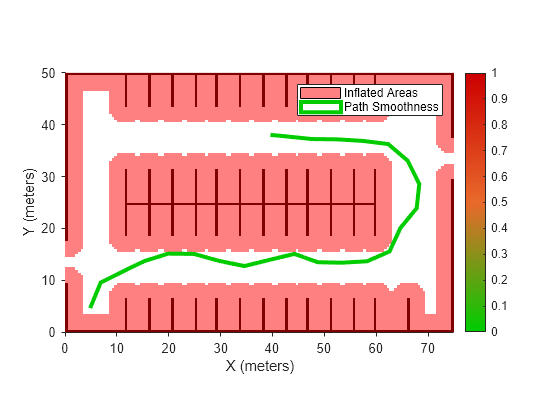
Compute and visualize the smoothness of the path. Values close to 0 indicate a smoother path. Straight-line paths return a value of 0.
smoothness(pathMetricsObj)
ans =
0.0842
show(pathMetricsObj,'Metrics',{'Smoothness'})
legend('Inflated Areas','Path Smoothness')
xlabel('X (meters)')
ylabel('Y (meters)')
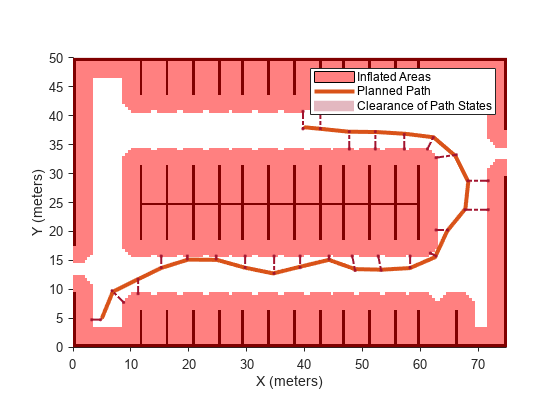
Visualize the clearance for each state of the path.
show(pathMetricsObj,'Metrics',{'StatesClearance'})
legend('Inflated Areas','Planned Path','Clearance of Path States')
xlabel('X (meters)')
ylabel('Y (meters)')
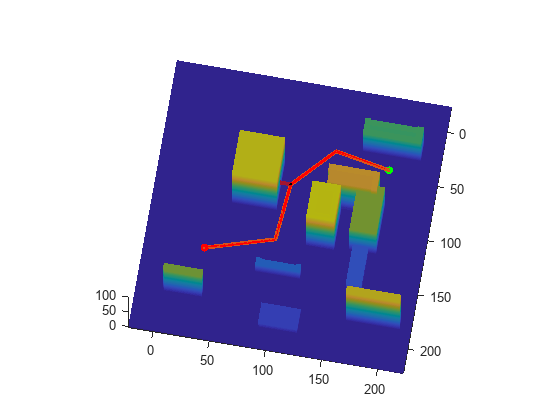
Plan a path through a city block using the RRT algorithm. Compute and visualize the smoothness, clearance, and validity of the planned path.
Load and Assign Map to State Validator
Load a 3-D occupancy map of a city block into the workspace. Specify the threshold to consider cells as obstacle-free.
mapData = load("dMapCityBlock.mat");
omap = mapData.omap;
omap.FreeThreshold = 0.5;
Inflate the occupancy map to add a buffer zone for safe operation around the obstacles.
inflate(omap,1)
Create an SE(3) state space object with bounds for state variables.
ss = stateSpaceSE3([0 220;0 220;0 100;inf inf;inf inf;inf inf;inf inf]);
Create a 3-D occupancy map state validator using the created state space. Assign the occupancy map to the state validator object. Specify the sampling distance interval.
sv = validatorOccupancyMap3D(ss, ...
     Map = omap, ...
     ValidationDistance = 0.1);
Plan Path
Create a RRT path planner with increased maximum connection distance and reduced maximum number of iterations. Specify a custom goal function that determines that a path reaches the goal if the Euclidean distance to the target is below a threshold of 1 meter.
planner = plannerRRT(ss,sv, ...
          MaxConnectionDistance = 50, ...
          MaxIterations = 1000, ...
          GoalReachedFcn = @(~,s,g)(norm(s(1:3)-g(1:3))<1), ...
          GoalBias = 0.1);
Specify start and goal poses.
start = [50 180 25 0.7 0.2 0 0.1];
goal = [150 33 35 0.3 0 0.1 0.6];
Configure the random number generator for repeatable result.
rng(1,"twister")Plan the path.
[pthObj,solnInfo] = plan(planner,start,goal);
Compute and Visualize Path Metrics
Create a path metrics object.
pathMetricsObj = pathmetrics(pthObj,sv);
Check path validity. The result is 1 (true) if the planned path is obstacle free. 0 (false) indicates an invalid path.
isPathValid(pathMetricsObj)
ans = logical
   1
Calculate the minimum clearance of the path.
clearance(pathMetricsObj)
ans =
10
Evaluate the smoothness of the path. Values close to 0 indicate a smoother path. Straight-line paths return a value of 0.
smoothness(pathMetricsObj)
ans =
0.0011
Visualize the minimum clearance of the path.
show(pathMetricsObj)
axis equal
view([100 75])
hold on
% Start state
scatter3(start(1,1),start(1,2),start(1,3),"g","filled")
% Goal state
scatter3(goal(1,1),goal(1,2),goal(1,3),"r","filled")
% Path
plot3(pthObj.States(:,1),pthObj.States(:,2),pthObj.States(:,3), ...
      "r-",LineWidth=2)
Input Arguments
Information for path metrics, specified as a pathmetrics object.
Version History
Introduced in R2019b
MATLAB Command
You clicked a link that corresponds to this MATLAB command:
Run the command by entering it in the MATLAB Command Window. Web browsers do not support MATLAB commands.
选择网站
选择网站以获取翻译的可用内容,以及查看当地活动和优惠。根据您的位置,我们建议您选择:。
您也可以从以下列表中选择网站:
如何获得最佳网站性能
选择中国网站(中文或英文)以获得最佳网站性能。其他 MathWorks 国家/地区网站并未针对您所在位置的访问进行优化。
美洲
- América Latina (Español)
- Canada (English)
- United States (English)
欧洲
- Belgium (English)
- Denmark (English)
- Deutschland (Deutsch)
- España (Español)
- Finland (English)
- France (Français)
- Ireland (English)
- Italia (Italiano)
- Luxembourg (English)
- Netherlands (English)
- Norway (English)
- Österreich (Deutsch)
- Portugal (English)
- Sweden (English)
- Switzerland
- United Kingdom (English)