Benchmark Path Planners for Differential Drive Robots in Warehouse Map
This example shows how to choose the best 2-D path planner for a differential drive robot in a warehouse environment from the available path planners. Use the plannerBenchmark object to benchmark the path planners plannerRRT, plannerRRTStar, plannerBiRRT, plannerPRM, and plannerHybridAstar on the warehouse environment with the randomly chosen start and goal poses. Compare the path planners based on their ability to find a valid path, clearance from the obstacles, time taken to initialize a planner, time taken to find a path, length of the path, and smoothness of the path. A suitable planner is chosen based on the performance of each path planner on the above mentioned metrics.
Set Up Environment
Create a binaryOccupancyMap object from a warehouse map. In the warehouse, the mobile robot moves from the loading station to the unloading station to place the goods.
map = load("wareHouseMap.mat").logicalMap;
map = binaryOccupancyMap(map);
Visualize the map.
figure
show(map)
title("Warehouse Floor Plan")

% Set the location of text displayed on the map.
loadingStationTextLoc = [40 9 0];
unloadingStationTextLoc = [7.5 42 0];
hold on
text(loadingStationTextLoc(1),loadingStationTextLoc(2),1,"Loading Station");
text(unloadingStationTextLoc(1),unloadingStationTextLoc(2),1,"Unloading Stations");
hold off
![Figure contains an axes object. The axes object with title Warehouse Floor Plan, xlabel X [meters], ylabel Y [meters] contains 3 objects of type image, text.](../../examples/nav/win64/BenchmarkingPathPlannersInWarehouseMapExample_01.png)
Define Environment and Planners for Benchmarking
Specify the minimum turning radius for the differential drive robot. Minimum turning radius constraint is imposed to have relatively smoother trajectory for the robot.
minTurningRadius = 1.4; % In meters.Create a stateSpaceDubins object with the state space bounds to be the same as map limits. set the minimum turning radius.
stateSpace = stateSpaceDubins([map.XWorldLimits; map.YWorldLimits; [-pi pi]]);
stateSpace.MinTurningRadius = minTurningRadius;
Create a validatorOccupancyMap state validator with the Dubins state space using the map. Specify the distance for interpolating and validating path segments.
validator = validatorOccupancyMap(stateSpace,Map=map);
validator.ValidationDistance = 0.01*(1/map.Resolution); % In meters.
Define the function handles for the initialization functions of each planners. For more information on these initialization functions, see Initialization Functions for Planners.
rrtInit = @(validator) plannerRRTWrapper(validator);
rrtStarInit = @(validator) plannerRRTStarWrapper(validator);
birrtInit = @(validator) plannerBiRRTWrapper(validator);
haStarInit = @(validator) plannerHybridAStarWrapper(validator,minTurningRadius);
prmInit = @(validator) plannerPRM(validator.StateSpace,validator,MaxNumNodes=80);
Define the function handle for the plan function, which is common for all the planners.
planFcn = @(initOutput,start,goal) plan(initOutput,start,goal);
Randomly Select Start-Goal Pairs on Warehouse Map
The start and goal locations are randomly sampled from the loading and unloading station area, respectively. Specify the number of start-goal pairs that must be randomly generated. In this example only three start-goal pair are chosen to reduce the execution time of this example. Increase the start-goal pair number to get sufficient map coverage.
% Set default random number for repeatability of results.
rng("default")

% Select the number of start-goal pairs.
numStartGoalPairs = 3;
The start location of the robot is sampled from the rectangle area marked as loading station and goal location is sampled from the rectangle area marked as unloading station area. Robot locations are sampled uniformly in the marked area. The rectangle area is specified as a vector of form [x y w h]. x and y specify the coordinate of the bottom left corner of the rectangle. w and h specify the width and height of the rectangle.
loadingArea = [51.5 11 5 10];
startLocations = helperSampleSelectedAreaOnMap(validator,loadingArea,numStartGoalPairs);

unloadingArea = [2 43.5 27 15];
goalLocations = helperSampleSelectedAreaOnMap(validator,unloadingArea,numStartGoalPairs);
Visualize the map with all the randomly sampled start and goal locations.
show(map)
title("Warehouse Floor Plan")

% Indicate the loading and unloading station on the map.
hold on
text(loadingStationTextLoc(1),loadingStationTextLoc(2),1,"Loading Station");
rectangle(Position=loadingArea)
text(unloadingStationTextLoc(1),unloadingStationTextLoc(2),1,"Unloading Stations");
rectangle(Position=unloadingArea)

% Set the length of the line representing the pose in the start-goal visualization.
r = 2;

% Display all the start-goal pairs on the map.
for i=1:numStartGoalPairs
    start = startLocations(i,:);
    goal = goalLocations(i,:);

    % Define the legend displayed on the map.
    startString = strcat("start location",num2str(i));
    goalString = strcat("goal location",num2str(i));

    % Display start and goal location of robot.
    p1 = plot(start(1,1),start(1,2),"o",DisplayName=startString);
    c1 = p1.Color;
    p2 = plot(goal(1,1),goal(1,2),"o",DisplayName=goalString);
    c2 = p2.Color;

    % Display start and goal headings.
    plot([start(1) start(1)+r*cos(start(3))],[start(2) start(2)+r*sin(start(3))],...
         "-",Color=c1,HandleVisibility="off")
    plot([goal(1) goal(1)+r*cos(goal(3))],[goal(2) goal(2)+r*sin(goal(3))],...
         "-",Color=c2,HandleVisibility="off")
end
hold off
legend(Location="northeastoutside")
![Figure contains an axes object. The axes object with title Warehouse Floor Plan, xlabel X [meters], ylabel Y [meters] contains 11 objects of type image, text, rectangle, line. One or more of the lines displays its values using only markers These objects represent start location1, goal location1, start location2, goal location2, start location3, goal location3.](../../examples/nav/win64/BenchmarkingPathPlannersInWarehouseMapExample_02.png)
Planner Benchmark Object Creation and Running Benchmark
Create a plannerBenchmark object for each start-goal pair and add the planners for benchmarking. The planner are executed twice on the same environment and start-goal pair by setting the runCount value to 2. This ensures the metrics results are accurate since sampling based planners like plannerRRT, plannerRRTStar, plannerBiRRT, and plannerPRM produce different output on the same set of start-goal pair. In this example runCount value is set to 2 to reduce the execution time of this example. Increase the runCount value to get more accurate benchmark results.
% To store the generated benchmark objects for each start-goal pair.
benchmarkList = cell(1,numStartGoalPairs);

% Specify the number of times each planner to be executed on the same
% set of start-goal pair.
runCount = 2;
for i=1:size(startLocations,1)

    % Get each start and goal location from all the sampled locations.
    start = startLocations(i,:);
    goal = goalLocations(i,:);

    % Set default random number for repeatability of results.
    rng("default")

    % Construct benchmark object.
    benchmark = plannerBenchmark(validator,start,goal);

    % Add planners for benchmarking using initialization and plan function
    % handles. Additional optional input NumPlanOutput define the number of
    % outputs returned from the plan function.
    addPlanner(benchmark,planFcn,rrtInit,PlannerName="rrt",NumPlanOutput=2)
    addPlanner(benchmark,planFcn,rrtStarInit,PlannerName="rrtStar",NumPlanOutput=2)
    addPlanner(benchmark,planFcn,birrtInit,PlannerName="biRRT",NumPlanOutput=2)
    addPlanner(benchmark,planFcn,prmInit,PlannerName="PRM",NumPlanOutput=2)
    addPlanner(benchmark,planFcn,haStarInit,PlannerName="hybridAstar",NumPlanOutput=2)

    % Run the benchmark.
    runPlanner(benchmark,runCount)

    % Store the benchmark for further analysis.
    benchmarkList{i} = benchmark;
end
Initializing rrt ...
Done.
Planning a path from the start pose (55.5736 20.1338 1.2229) to the goal pose (27.9063 56.2369 1.9757) using rrt.
Executing run 1.
Executing run 2.
Initializing rrtStar ...
Done.
Planning a path from the start pose (55.5736 20.1338 1.2229) to the goal pose (27.9063 56.2369 1.9757) using rrtStar.
Executing run 1.
Executing run 2.
Initializing biRRT ...
Done.
Planning a path from the start pose (55.5736 20.1338 1.2229) to the goal pose (27.9063 56.2369 1.9757) using biRRT.
Executing run 1.
Executing run 2.
Initializing PRM ...
Done.
Planning a path from the start pose (55.5736 20.1338 1.2229) to the goal pose (27.9063 56.2369 1.9757) using PRM.
Executing run 1.
Executing run 2.
Initializing hybridAstar ...
Done.
Planning a path from the start pose (55.5736 20.1338 1.2229) to the goal pose (27.9063 56.2369 1.9757) using hybridAstar.
Executing run 1.
Executing run 2.
Initializing rrt ...
Done.
Planning a path from the start pose (56.029 17.3236 1.6444) to the goal pose (19.705 57.5099 1.9527) using rrt.
Executing run 1.
Executing run 2.
Initializing rrtStar ...
Done.
Planning a path from the start pose (56.029 17.3236 1.6444) to the goal pose (19.705 57.5099 1.9527) using rrtStar.
Executing run 1.
Executing run 2.
Initializing biRRT ...
Done.
Planning a path from the start pose (56.029 17.3236 1.6444) to the goal pose (19.705 57.5099 1.9527) using biRRT.
Executing run 1.
Executing run 2.
Initializing PRM ...
Done.
Planning a path from the start pose (56.029 17.3236 1.6444) to the goal pose (19.705 57.5099 1.9527) using PRM.
Executing run 1.
Executing run 2.
Initializing hybridAstar ...
Done.
Planning a path from the start pose (56.029 17.3236 1.6444) to the goal pose (19.705 57.5099 1.9527) using hybridAstar.
Executing run 1.
Executing run 2.
Initializing rrt ...
Done.
Planning a path from the start pose (52.1349 11.9754 2.2894) to the goal pose (19.6979 43.9775 0.93797) using rrt.
Executing run 1.
Executing run 2.
Initializing rrtStar ...
Done.
Planning a path from the start pose (52.1349 11.9754 2.2894) to the goal pose (19.6979 43.9775 0.93797) using rrtStar.
Executing run 1.
Executing run 2.
Initializing biRRT ...
Done.
Planning a path from the start pose (52.1349 11.9754 2.2894) to the goal pose (19.6979 43.9775 0.93797) using biRRT.
Executing run 1.
Executing run 2.
Initializing PRM ...
Done.
Planning a path from the start pose (52.1349 11.9754 2.2894) to the goal pose (19.6979 43.9775 0.93797) using PRM.
Executing run 1.
Executing run 2.
Initializing hybridAstar ...
Done.
Planning a path from the start pose (52.1349 11.9754 2.2894) to the goal pose (19.6979 43.9775 0.93797) using hybridAstar.
Executing run 1.
Executing run 2.
Average Metrics Across All Start-Goal Pairs
All the planner are executed runCount times for each start-goal pair. Also all the planners are executed for all the start-goal pairs. This means that all planners are executed runCount*numStartGoalPairs times. The plots and tables below show the average metric value across all the start-goal pairs. The tables represent the Mean, Median, and Standard Deviation of each metric averaged across all the start-goal pairs.
The clearance metric represent the minimum distance of the path from the obstacles in the environment. The plot shows that plannerPRM has the highest clearance.
helperPlotAveragedMetrics(benchmarkList,runCount,"clearance")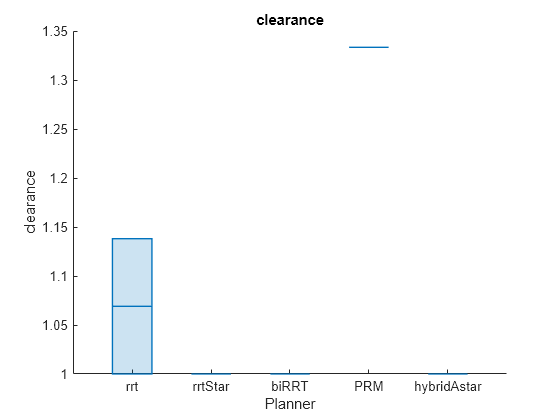
clearanceAverage = helperCalculateAverageMetricTable(benchmarkList,"clearance")clearanceAverage=5×3 table
Mean Median stdDev
______ ______ ________
rrt 1.069 1 0.097631
rrtStar 1 1 0
biRRT 1 1 0
PRM 1.3333 1 0.4714
hybridAstar 1 1 0
The isPathValid metric represent the success rate of each planner expressed in percentage. The plot shows that all the path planners produced valid path for all the start-goal pairs.
helperPlotAveragedMetrics(benchmarkList,runCount,"isPathValid")
isPathValidAverage = helperCalculateAverageMetricTable(benchmarkList,"isPathValid")isPathValidAverage=5×3 table
Mean Median stdDev
____ ______ ______
rrt 100 100 0
rrtStar 100 100 0
biRRT 100 100 0
PRM 100 100 0
hybridAstar 100 100 0
The executionTime metric represent the time taken by the plan function to execute. The plot shows that plannerBiRRT took the least time. plannerRRTStar took the maximum time since ContinueAfterGoalReached property is enabled and the planner tries to find optimal paths.
helperPlotAveragedMetrics(benchmarkList,runCount,"executionTime")
execTimeAverage = helperCalculateAverageMetricTable(benchmarkList,"executionTime")execTimeAverage=5×3 table
Mean Median stdDev
________ ________ ________
rrt 0.22425 0.20275 0.084197
rrtStar 1.4152 1.304 0.22444
biRRT 0.042898 0.045193 0.010654
PRM 0.023103 0.014082 0.013072
hybridAstar 0.12281 0.086053 0.08999
The initializationTime metric indicate the time taken to execute the initialization function of each planner. plannerPRM has the longest initialization time and plannerBiRRT has the least execution time.
Total execution time is the sum of initializationTime and executionTime.
helperPlotAveragedMetrics(benchmarkList,runCount,"initializationTime")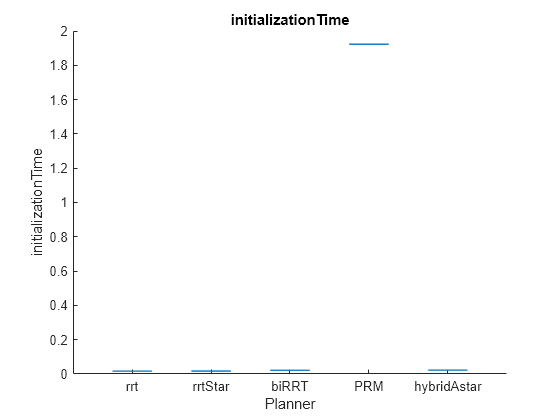
initTimeAverage = helperCalculateAverageMetricTable(benchmarkList,"initializationTime")initTimeAverage=5×3 table
Mean Median stdDev
________ ________ _________
rrt 0.014071 0.012892 0.0061147
rrtStar 0.015174 0.01748 0.0081789
biRRT 0.023428 0.010313 0.02284
PRM 1.5789 1.6373 0.33263
hybridAstar 0.019608 0.009872 0.016377
The pathLength metric represent the length of the generated path. plannerHybridAstar has the shortest path, followed by plannerRRTStar and plannerBiRRT with similar average path length.
helperPlotAveragedMetrics(benchmarkList,runCount,"pathLength")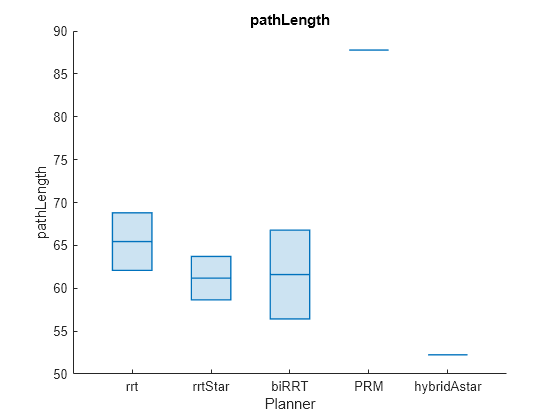
pathLengthAverage = helperCalculateAverageMetricTable(benchmarkList,"pathLength")pathLengthAverage=5×3 table
Mean Median stdDev
______ ______ ______
rrt 65.44 65.103 8.8336
rrtStar 61.179 61.903 6.2276
biRRT 61.6 63.412 4.743
PRM 87.775 70.339 26.23
hybridAstar 52.24 49.248 5.2636
The smoothness metric represent the smoothness of the path for all poses. plannerBiRRT produced the smoothest path (lower smoothness value indicate smoother path) followed by plannerPRM. Observe that plannerRRTStar produced considerably smoother path compared to plannerRRT.
helperPlotAveragedMetrics(benchmarkList,runCount,"smoothness")
smoothnessAverage = helperCalculateAverageMetricTable(benchmarkList,"smoothness")smoothnessAverage=5×3 table
Mean Median stdDev
_______ ________ ________
rrt 0.92635 0.77845 0.2669
rrtStar 0.53077 0.5488 0.066147
biRRT 0.10321 0.10285 0.006485
PRM 0.19031 0.082896 0.18029
hybridAstar 1.7269 1.6006 0.44726
If the slightly longer path is not a concern then consider using plannerBiRRT for path planning in a warehouse map setup as shown in this example, since it has the smoothest path and lesser execution time. If the path travelled by the robot should be the least then plannerHybridAstar could be considered.
Increasing the number of start-goal pairs and runCount to a considerably larger value will produce more accurate metrics results and better judgment of which path planner to choose.
Visualize Metric Results for Specific Start-Goal Pair
The above tables and graphs showed the metric results averaged across all the start-goal pairs. plannerBiRRT produced smoother path overall but the path length was slightly longer than plannerHybridAstar, which produced the least path length. Probe the start-goal pairs to see which start-goal pair produced the longest path length for plannerBiRRT.
pathLengthMean = zeros(1,numStartGoalPairs);

% Iterate over all the benchmarks and store the mean path length for each
% start-goal pair.
for i=1:numStartGoalPairs
    benchmark = benchmarkList{i};
    pathLengthTable= benchmark.metric("pathLength");
    pathLengthMean(i) = pathLengthTable.Mean("biRRT");
end

% Find the index of the benchmark which produced largest mean path length
% value for plannerBiRRT.
[~,largestPathLengthIdx] = max(pathLengthMean);
benchmarkLargestPathlength = benchmarkList{largestPathLengthIdx};
show(benchmarkLargestPathlength,"pathLength")

pathLength = metric(benchmarkLargestPathlength,"pathLength")pathLength=5×4 table
Mean Median StdDev sampleSize
______ ______ ______ __________
rrt 76.424 76.424 1.9865 2
rrtStar 68.419 68.419 4.7522 2
biRRT 66.287 66.287 1.7031 2
PRM 70.339 70.339 0 2
hybridAstar 59.639 59.639 0 2
Visualize Path from All Planners for Specific Start-Goal Pair
Visualize the path output from all the planners for the start-goal pair that produced the longest path length for plannerBiRRT.
% Retrieve the start and goal location from the benchmark object.
start = benchmarkLargestPathlength.Start;
goal = benchmarkLargestPathlength.Goal;

% Display the path from start location to goal location for all the path
% planners for all the runs in runCount.
for run=1:runCount
    figure
    show(map)
    title(['Path output from all planners for Run ' num2str(run)])
    hold on

    % Show start and goal positions of robot.
    plot(start(1,1),start(1,2),"o")
    plot(goal(1,1),goal(1,2),"o")

    % Find the planner names used for benchmarking.
    plannerNames = fieldnames(benchmarkLargestPathlength.PlannerOutput);
    numPlanners = length(plannerNames);
    runString = strcat("Run",num2str(run));

    % Iterate and plot path of each planner for the specified run.
    for i=1:numPlanners
        plannerName = plannerNames{i};
        plannerOutput = benchmarkLargestPathlength.PlannerOutput.(plannerName).PlanOutput.(runString);
        pathObj = plannerOutput{1};

        % Insert more states in the path to visualize the dubins curve.
        interpolate(pathObj,200);
        plot(pathObj.States(:,1),pathObj.States(:,2),"-","LineWidth",2)
    end

    % Specify the legends.
    labels = [{"start location","goal location"} plannerNames'];
    legend(labels,location="northeastoutside")
    hold off
end
![Figure contains an axes object. The axes object with title Path output from all planners for Run 1, xlabel X [meters], ylabel Y [meters] contains 8 objects of type image, line. One or more of the lines displays its values using only markers These objects represent start location, goal location, rrt, rrtStar, biRRT, PRM, hybridAstar.](../../examples/nav/win64/BenchmarkingPathPlannersInWarehouseMapExample_10.png)
![Figure contains an axes object. The axes object with title Path output from all planners for Run 2, xlabel X [meters], ylabel Y [meters] contains 8 objects of type image, line. One or more of the lines displays its values using only markers These objects represent start location, goal location, rrt, rrtStar, biRRT, PRM, hybridAstar.](../../examples/nav/win64/BenchmarkingPathPlannersInWarehouseMapExample_11.png)
Further Evaluation
From the results, you can observe that the path generated by all the planners have redundant nodes. You can remove these redundant nodes by using the shortenpath function. The shortenpath function refines the paths by removing redundant nodes and also significantly reduces the path length. To benchmark the path planners after removing the redundant nodes, replace the planFcn function handle input in the addPlanner function with the following code.
planFcnWithShorten = @(initOutput,start,goal) planWithShorten(initOutput,start,goal);

% To store the generated benchmark objects for each start-goal pair.
rrtBenchmarkList = cell(1,numStartGoalPairs);

% Specify the number of times each planner to be executed on the same
% set of start-goal pair.
rrtRunCount = 2;
This example shows the result of refining the path generated by RRT path planner using the shortenpath function. This result is then compared with the path produced by the RRTStar path planner.
for i=1:height(startLocations)

    % Get each start and goal location from all the sampled locations.
    start = startLocations(i,:);
    goal = goalLocations(i,:);

    % Construct benchmark object.
    benchmark = plannerBenchmark(validator,start,goal);

    % Add planners for benchmarking using initialization and plan function
    % handles. Additional optional input NumPlanOutput define the number of
    % outputs returned from the plan function.
    addPlanner(benchmark,planFcnWithShorten,rrtInit,PlannerName="rrtWithShorten",NumPlanOutput=2)
    addPlanner(benchmark,planFcn,rrtStarInit,PlannerName="rrtStar",NumPlanOutput=2)

    % Run the benchmark.
    runPlanner(benchmark,rrtRunCount, Verbose="off")

    % Store the benchmark for further analysis.
    rrtBenchmarkList{i} = benchmark;
end
Plot Metrics
helperPlotAveragedMetrics(rrtBenchmarkList,rrtRunCount,"pathLength")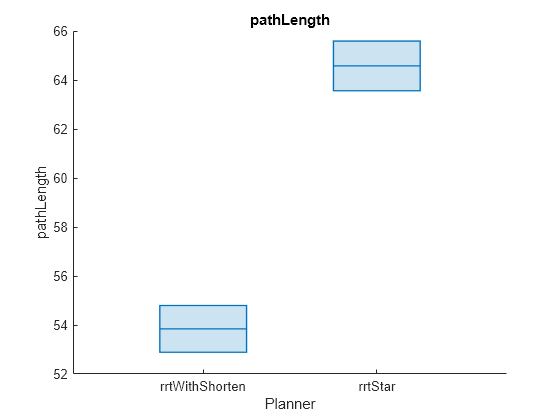
rrtClearanceAvg = helperCalculateAverageMetricTable(rrtBenchmarkList,"pathLength")rrtClearanceAvg=2×3 table
Mean Median stdDev
______ ______ ______
rrtWithShorten 53.842 52.574 5.0681
rrtStar 64.576 62.545 5.0423
helperPlotAveragedMetrics(rrtBenchmarkList,rrtRunCount,"executionTime")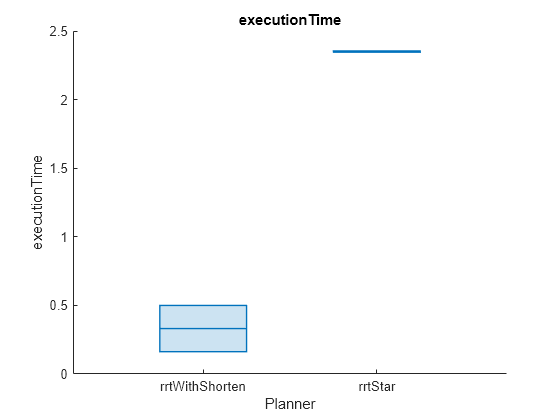
rrtExecTimeAvg = helperCalculateAverageMetricTable(rrtBenchmarkList,"executionTime") rrtExecTimeAvg=2×3 table
Mean Median stdDev
_______ _______ _________
rrtWithShorten 0.1338 0.14389 0.050524
rrtStar 0.98294 0.9786 0.0089064
helperPlotAveragedMetrics(rrtBenchmarkList,rrtRunCount,"smoothness")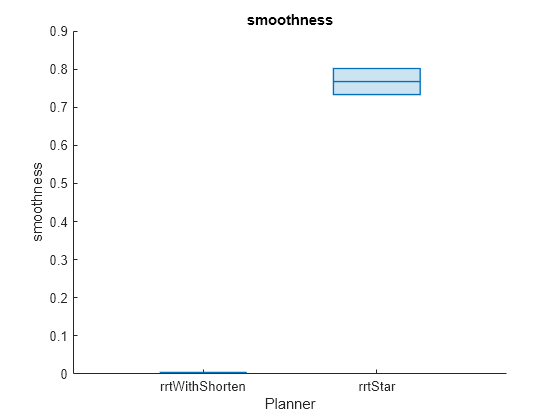
rrtSmoothnessAvg = helperCalculateAverageMetricTable(rrtBenchmarkList,"smoothness")rrtSmoothnessAvg=2×3 table
Mean Median stdDev
_________ ________ _________
rrtWithShorten 0.0039555 0.004813 0.0015887
rrtStar 0.76739 0.75112 0.069996
While RRTStar is known to generate smoother paths than RRT, it incurs a higher execution time. Utilizing the shortenpath function on RRT-generated paths, reduces the path length and achieves smoothness better than RRTStar, but with significantly less execution time.
However, it's important to note that for higher number of iterations, plannerRRTStar can converge to an optimal path, whereas plannerRRT with shortening does not guarantee an optimal path.
Initialization Functions for Planners
Initialization function for plannerHybridAStar.
function planner = plannerHybridAStarWrapper(validator,minTurningRadius)
    map = validator.Map;
    ss = stateSpaceSE2;
    sv = validatorOccupancyMap(ss,Map=map);
    sv.ValidationDistance = validator.ValidationDistance;
    planner = plannerHybridAStar(sv,MinTurningRadius=minTurningRadius);
end
Initialization function for plannerBiRRT.
function planner = plannerBiRRTWrapper(sv)
    planner = plannerBiRRT(sv.StateSpace,sv);
    planner.EnableConnectHeuristic = true;
    planner.MaxIterations = 5e4;
    planner.MaxNumTreeNodes = 5e4;
    planner.MaxConnectionDistance = 5;
end
Initialization function for plannerRRTStar.
function planner = plannerRRTStarWrapper(sv)
    planner = plannerRRTStar(sv.StateSpace,sv);
    planner.MaxIterations = 2.5e3;
    planner.MaxNumTreeNodes = 2.5e3;
    planner.MaxConnectionDistance = 3;
    planner.ContinueAfterGoalReached = true;
end
Initialization function for plannerRRT.
function planner = plannerRRTWrapper(sv)
    planner = plannerRRT(sv.StateSpace,sv);
    planner.MaxIterations = 2.5e3;
    planner.MaxNumTreeNodes = 2.5e3;
    planner.MaxConnectionDistance = 3;
end
Plan function for plannerRRT with shortenpath
function [shortenedPath,solnInfo] = planWithShorten(planner, start, goal)
    [path,solnInfo] = plan(planner, start, goal);
    shortenedPath = shortenpath(path, planner.StateValidator);
end