Main Content

pattern

System object: phased.ShortDipoleAntennaElement
Namespace: phased

Plot short-dipole antenna element directivity and patterns

Syntax

pattern(sElem,FREQ)
pattern(sElem,FREQ,AZ)
pattern(sElem,FREQ,AZ,EL)
pattern(___,Name,Value)
[PAT,AZ_ANG,EL_ANG] = pattern(___)

Description

pattern(sElem,FREQ) plots the 3-D array directivity pattern (in dBi) for the element specified in sElem. The operating frequency is specified in FREQ.

pattern(sElem,FREQ,AZ) plots the element directivity pattern at the specified azimuth angle.

pattern(sElem,FREQ,AZ,EL) plots the element directivity pattern at specified azimuth and elevation angles.

pattern(___,Name,Value) plots the element pattern with additional options specified by one or more Name,Value pair arguments.

[PAT,AZ_ANG,EL_ANG] = pattern(___) returns the element pattern in PAT. The AZ_ANG output contains the coordinate values corresponding to the rows of PAT. The EL_ANG output contains the coordinate values corresponding to the columns of PAT. If the 'CoordinateSystem' parameter is set to 'uv', then AZ_ANG contains the U coordinates of the pattern and EL_ANG contains the V coordinates of the pattern. Otherwise, they are in angular units in degrees. UV units are dimensionless.

Note

This method replaces the plotResponse method. See Convert plotResponse to pattern for guidelines on how to use pattern in place of plotResponse.

Input Arguments

expand all

Short-dipole antenna element, specified as a phased.ShortDipoleAntennaElement System object.

Example: sElem = phased.ShortDipoleAntennaElement;

Frequencies for computing directivity and patterns, specified as a positive scalar or 1-by-L real-valued row vector. Frequency units are in hertz.

  • For an antenna, microphone, or sonar hydrophone or projector element, FREQ must lie within the range of values specified by the FrequencyRange or FrequencyVector property of the element. Otherwise, the element produces no response and the directivity is returned as –Inf. Most elements use the FrequencyRange property except for phased.CustomAntennaElement and phased.CustomMicrophoneElement, which use the FrequencyVector property.

  • For an array of elements, FREQ must lie within the frequency range of the elements that make up the array. Otherwise, the array produces no response and the directivity is returned as –Inf.

Example: [1e8 2e6]

Data Types: double

Azimuth angles for computing directivity and pattern, specified as a 1-by-N real-valued row vector where N is the number of azimuth angles. Angle units are in degrees. Azimuth angles must lie between –180° and 180°.

The azimuth angle is the angle between the x-axis and the projection of the direction vector onto the xy plane. When measured from the x-axis toward the y-axis, this angle is positive.

Example: [-45:2:45]

Data Types: double

Elevation angles for computing directivity and pattern, specified as a 1-by-M real-valued row vector where M is the number of desired elevation directions. Angle units are in degrees. The elevation angle must lie between –90° and 90°.

The elevation angle is the angle between the direction vector and xy-plane. The elevation angle is positive when measured towards the z-axis.

Example: [-75:1:70]

Data Types: double

Name-Value Arguments

Specify optional pairs of arguments as Name1=Value1,...,NameN=ValueN, where Name is the argument name and Value is the corresponding value. Name-value arguments must appear after other arguments, but the order of the pairs does not matter.

Before R2021a, use commas to separate each name and value, and enclose Name in quotes.

Plotting coordinate system of the pattern, specified as the comma-separated pair consisting of 'CoordinateSystem' and one of 'polar', 'rectangular', or 'uv'. When 'CoordinateSystem' is set to 'polar' or 'rectangular', the AZ and EL arguments specify the pattern azimuth and elevation, respectively. AZ values must lie between –180° and 180°. EL values must lie between –90° and 90°. If 'CoordinateSystem' is set to 'uv', AZ and EL then specify U and V coordinates, respectively. AZ and EL must lie between -1 and 1.

Example: 'uv'

Data Types: char

Displayed pattern type, specified as the comma-separated pair consisting of 'Type' and one of

  • 'directivity' — directivity pattern measured in dBi.

  • 'efield' — field pattern of the sensor or array. For acoustic sensors, the displayed pattern is for the scalar sound field.

  • 'power' — power pattern of the sensor or array defined as the square of the field pattern.

  • 'powerdb' — power pattern converted to dB.

Example: 'powerdb'

Data Types: char

Display normalized pattern, specified as the comma-separated pair consisting of 'Normalize' and a Boolean. Set this parameter to true to display a normalized pattern. This parameter does not apply when you set 'Type' to 'directivity'. Directivity patterns are already normalized.

Data Types: logical

Plotting style, specified as the comma-separated pair consisting of 'Plotstyle' and either 'overlay' or 'waterfall'. This parameter applies when you specify multiple frequencies in FREQ in 2-D plots. You can draw 2-D plots by setting one of the arguments AZ or EL to a scalar.

Data Types: char

Polarized field component to display, specified as the comma-separated pair consisting of 'Polarization' and 'combined', 'H', or 'V'. This parameter applies only when the sensors are polarization-capable and when the 'Type' parameter is not set to 'directivity'. This table shows the meaning of the display options.

'Polarization'Display
'combined'Combined H and V polarization components
'H'H polarization component
'V'V polarization component

Example: 'V'

Data Types: char

Output Arguments

expand all

Element pattern, returned as an N-by-M real-valued matrix. The pattern is a function of azimuth and elevation. The rows of PAT correspond to the azimuth angles in the vector specified by EL_ANG. The columns correspond to the elevation angles in the vector specified by AZ_ANG.

Azimuth angles for displaying directivity or response pattern, returned as a scalar or 1-by-N real-valued row vector corresponding to the dimension set in AZ. The columns of PAT correspond to the values in AZ_ANG. Units are in degrees.

Elevation angles for displaying directivity or response, returned as a scalar or 1-by-M real-valued row vector corresponding to the dimension set in EL. The rows of PAT correspond to the values in EL_ANG. Units are in degrees.

Examples

expand all

Specify a short-dipole antenna element with its dipole axis pointing along the z-axis. To do so, set the 'AxisDirection' value to 'Z'.

sSD = phased.ShortDipoleAntennaElement(...
    'FrequencyRange',[100 900]*1e6,'AxisDirection','Z');

Plot the antenna's vertical polarization power pattern at 200 MHz as a 3-D polar plot.

fc = 200e6;
pattern(sSD,fc,[-180:180],[-90:90],...
    'CoordinateSystem','polar',...
    'Type','powerdb',...
    'Polarization','V')

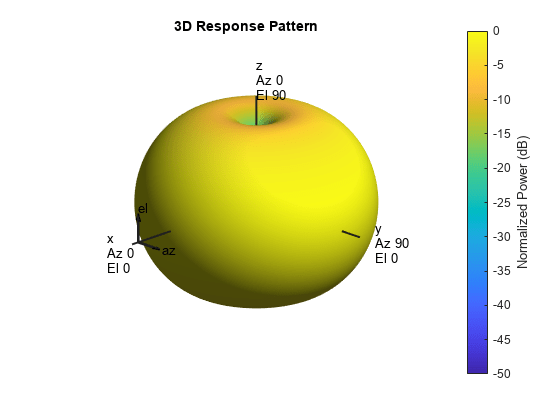
As the above figure shows, the antenna pattern is that of a vertically-oriented dipole and has its maximum at the equator and nulls at the poles.

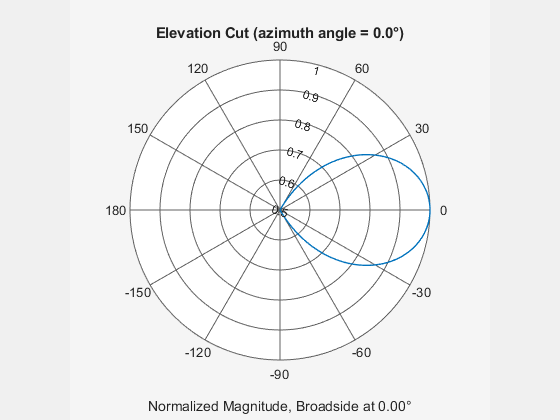
Specify a short-dipole antenna element with its dipole axis pointing along the z-axis. Then, plot the magnitude pattern over a selected range of angles. The antenna operating frequency spans the range 100 to 900 MHz.

To construct a z-directed short-dipole antenna, set the 'AxisDirection' value to 'Z'.

sSD = phased.ShortDipoleAntennaElement(...
    'FrequencyRange',[100 900]*1e6,...
    'AxisDirection','Z');

Plot the antenna's vertical polarization response at 200 MHz as an elevation cut at zero degrees azimuth angle. Restrict the plot from -60 to 60 degrees elevation in 0.1 degree increments.

fc = 200e6;
pattern(sSD,fc,0,[-60:0.1:60],...
    'CoordinateSystem','polar',...
    'Type','efield',...
    'Polarization','V')

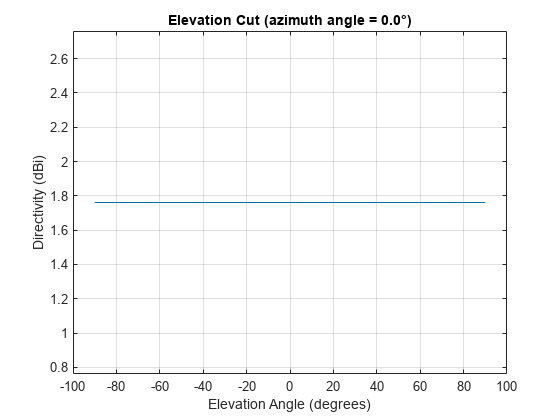
Specify a short-dipole antenna element with its dipole axis pointing along the y-axis. Then, plot the directivity. The antenna operating frequency spans the range 100 to 900 MHz.

Construct a y-directed short-dipole antenna by setting the 'AxisDirection' value to 'Y'.

sSD = phased.ShortDipoleAntennaElement(...
    'FrequencyRange',[100 900]*1e6,...
    'AxisDirection','Y');

Plot the antenna's directivity at 500 MHz as an elevation cut at zero degrees azimuth angle.

fc = 500e6;
pattern(sSD,fc,0,[-90:90],...
    'CoordinateSystem','rectangular',...
    'Type','directivity')

More About

expand all

Version History

Introduced in R2015a