Main Content

animate

Replace existing data with new data for animation

Description

example

animate(p,data) removes all the current data from polar plot, p and adds new data, based on real amplitude values, data.

example

animate(p,angle,magnitude) removes all the current data polar plot, p and adds new data sets of angle vectors and corresponding magnitude matrices.

Examples

collapse all

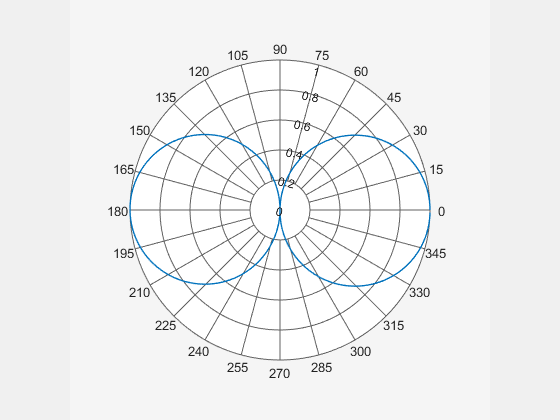
Create a cosine-pattern antenna and plot the pattern from 0° to 360°.

az = [0:360];
p1 = abs(cosd(az));

Plot the polar pattern.

P = polarpattern(p1);

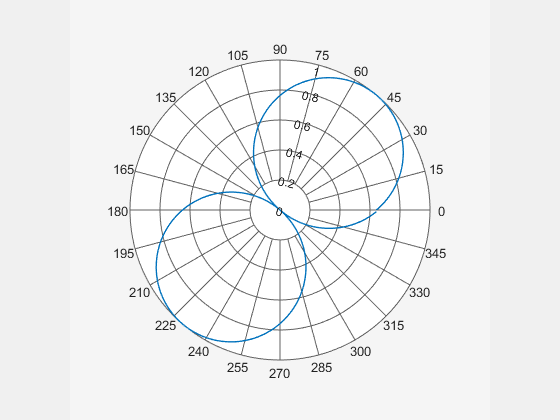
Create a second cosine-pattern antenna rotated by 60°. Animate the pattern by adding this pattern.

p2 = abs(cosd(az - 50));
animate(P,p2);

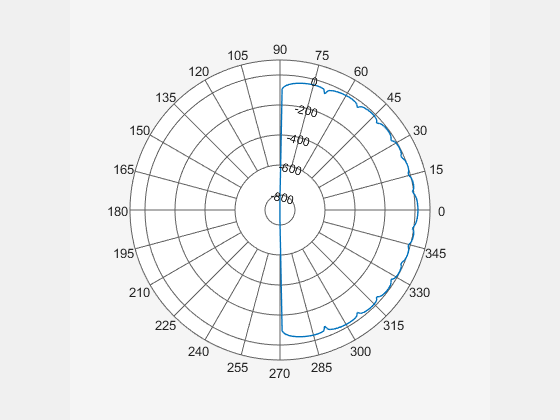
Create a 15-element ULA of cosine antennas with elements spaced one-half wavelength apart. Plot the directivity of the array at 20 GHz.

fc = 20.0e9;
c = physconst('Lightspeed');
lam = c/fc;
angs = [-180:1:180];
antenna = phased.CosineAntennaElement('FrequencyRange',[1.0e9,100.0e9],...
    'CosinePower',[2.5 2.5]);
array = phased.ULA('Element',antenna,'NumElements',15,'ElementSpacing',lam/2);
a = pattern(array,fc,angs,0);
P = polarpattern(angs,a);

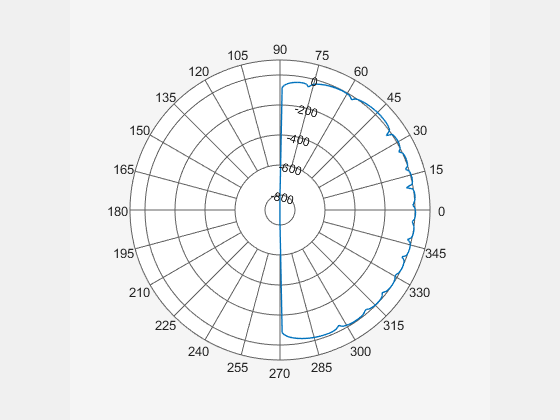
Then, steer the array to 45° and, using the animate method, replace the existing polar plot with the steered array directivity.

steervec = phased.SteeringVector('SensorArray',array,'PropagationSpeed',c,...
    'IncludeElementResponse',true);
sv = steervec(fc,[45;0]);
a1 = pattern(array,fc,angs,0,'Weights',sv);
animate(P,angs,a1);

Input Arguments

collapse all

Polar plot, specified as a scalar handle.

Example: polarpattern

Antenna or array pattern data, specified as one of the following:

  • A real length-M vector, where M contains the magnitude values with angles assumed to be (0:M1)M×360 degrees.

  • A real M-by-N matrix, where M contains the magnitude values and N contains the independent data sets. Each column in the matrix has angles taken from the vector (0:M1)M×360 degrees. The set of each angle can vary for each column.

  • A real N-D array, where N is the number of dimensions. Arrays with dimensions 2 and greater are independent data sets.

  • A complex vector or matrix, where data contains Cartesian coordinates ((x,y) of each point. x contains the real part of data and y contains the imaginary part of data.

When data is in a logarithmic form such as dB, magnitude values can be negative. In this case,polarpattern plots the lowest magnitude values at the origin of the polar plot and highest magnitude values at the maximum radius.

Example: pattern(dipole,70e6)

Set of angles, specified as a vector in degrees.

Set of magnitude values, specified as a vector or a matrix. For a matrix of magnitude values, each column is an independent set of magnitude values and corresponds to the same set of angles.

Version History

Introduced in R2016a