主要内容

drawShape

R2026b

Interactively draw shape in point cloud viewer

Since R2026b

    Description

    roi = drawShape(pcview,shape) enters interactive mode, enabling you to draw the shape specified by shape in the point cloud viewer specified by pcview.

    roi = drawShape(___,Name=Value) specifies options using one or more name-value arguments in addition to the input arguments from the previous syntax. For example, Color="yellow" sets the color of the drawn shape to yellow.

    Examples

    collapse all

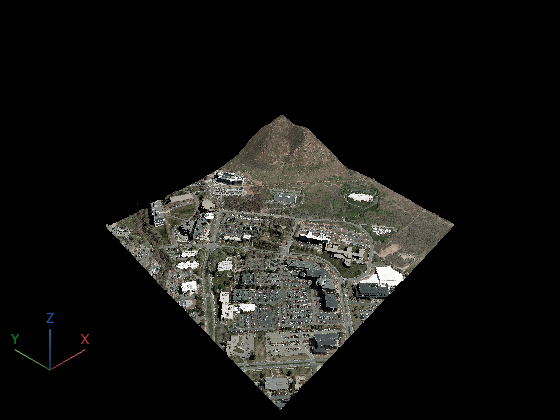
    Download and read a USGS lidar tile [1] covering the Wasatch Mountain foothills near the University of Utah campus.

    tileURL = "https://rockyweb.usgs.gov/vdelivery/Datasets/Staged/Elevation/LPC/Projects/Wasatch_Fault_UT_LiDAR/UT_Wasatch_L4_2013/LAZ/USGS_LPC_Wasatch_Fault_UT_LiDAR_12TVL3000012000.laz";
    localFile = fullfile(tempdir,"USGS_LPC_Wasatch_Fault_UT_LiDAR_12TVL3000012000.laz");
    if ~exist(localFile,"file")
        websave(localFile,tileURL);
    end
    
    reader = lasFileReader(localFile);
    ptCloud = readPointCloud(reader);

    Launch pcviewer.

    pcview = pcviewer(ptCloud);

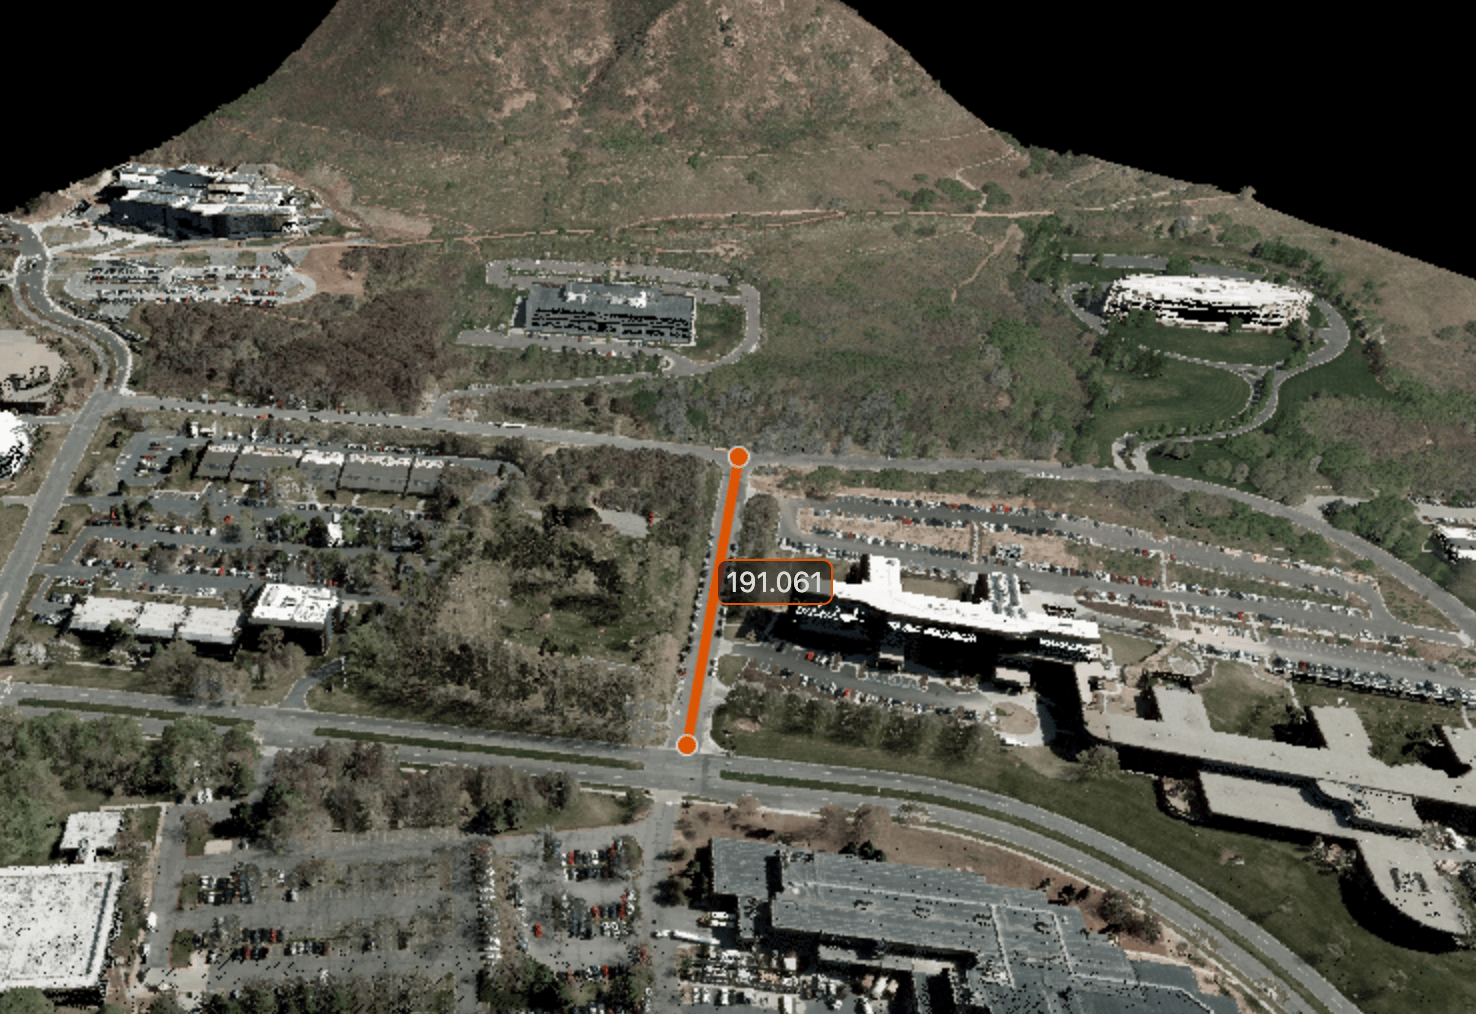
    Enable the interactive drawing tool for a line in the viewer window. Click two points on the point cloud to measure the distance between them. To reposition an endpoint, drag it. To translate the line without resizing, hold Ctrl while dragging. MATLAB blocks until you finish drawing.

    roi = drawShape(pcview, "line");
    This screenshot shows the display after interactively drawing a line.
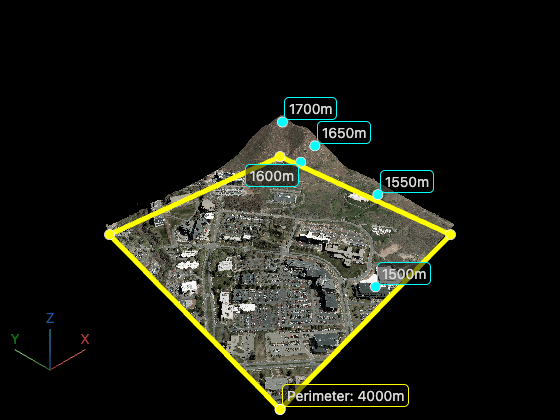
    Place annotations programmatically by specifying the Position argument. Draw a polyline along the tile boundary and mark elevation bands across the terrain.

    xMin = ptCloud.XLimits(1);
    xMax = ptCloud.XLimits(2);
    yMin = ptCloud.YLimits(1);
    yMax = ptCloud.YLimits(2);
    zMin = ptCloud.ZLimits(1);
    
    cornerPoints = [xMin yMin zMin;
                    xMin yMax zMin;
                    xMax yMax zMin;
                    xMax yMin zMin;
                    xMin yMin zMin];
    
    pcview2 = pcviewer(ptCloud);
    poly = drawShape(pcview2,"polyline",Position=cornerPoints,Color="yellow");
    poly.Label = sprintf("Perimeter: %dm",poly.TotalLength);
    
    elevations = [1500 1550 1600 1650 1700];
    for i = 1:numel(elevations)
        elev = elevations(i);
        [~, idx] = min(abs(ptCloud.Location(:,3) - elev));
        pos = double(ptCloud.Location(idx,:));
        drawShape(pcview2,"point",Position=pos,Color="cyan",Label=sprintf("%dm",elev));
    end
    References

    [1] USGS Lidar Point Cloud UT_Wasatch_L4_2013 courtesy of the U.S. Geological Survey

    Input Arguments

    collapse all

    Point cloud viewer in which to draw the shape, specified as a pcviewer object.

    Type of shape to draw, specified as one of these values:

    • "point"

    • "line"

    • "polyline"

    • "polygon"

    • "cuboid"

    • "angle"

    • "elevation"

    • "circle"

    • "freehand"

    Name-Value Arguments

    collapse all

    Specify optional pairs of arguments as Name1=Value1,...,NameN=ValueN, where Name is the argument name and Value is the corresponding value. Name-value arguments must appear after other arguments, but the order of the pairs does not matter.

    Example: drawShape(pcview,shape,Color="yellow") sets the color of the drawn shape to yellow.

    Position of the shape in the display, specified as one of these options, depending on the value of the shape argument.

    shape ValueDimensionDescription
    "point"1-by-3 vectorPoint location in the form [x y z].
    "line"

    • 1-by-6 vector

    • 2-by-3 matrix

    Line segment defined by two endpoints. Specify the endpoints as [x1 y1 z1 x2 y2 z2],, or as a 2-by-3 matrix where each row is an endpoint in the form [x y z].
    "polyline"M-by-3 matrixEach row specifies one polyline vertex in the form [x y z].
    "polygon"M-by-3 matrixEach row specifies one polyline vertex in the form [x y z].
    "cuboid"

    1-by-9 vector

    One cuboid specified in the form [xctr yctr zctr xlen ylen zlen xrot yrot zrot], where the values define the cuboid center, dimensions, and orientation.
    "angle"3-by-3 matrixThree points specified in the form [x1 y1 z1; x2 y2 z2; x3 y3 z3], where the second row specifies the angle vertex.
    "elevation"

    • 1-by-6 vector

    • 2-by-3 matrix

    Elevation measurement defined by two points. Specify the points as [x1 y1 z1 x2 y2 z2], or as a 2-by-3 matrix where each row is a point in the form [x y z].
    "circle"

    1-by-4 vector

    Circle specified in the form [x y z radius], where [x y z] specifies the center location.
    "freehand"M-by-3 matrixEach row specifies one freehand vertex in the form [x y z].

    Shape color, specified as an RGB triplet, a short color name, a long color name, or an M-by-3 matrix of RGB triplets. When you specify a single color, the function applies that color to all shapes. When you specify multiple colors, the number of colors must match the number of shapes specified by Position.

    Shape label, specified as a string scalar or character vector. By default, the function displays a measurement label based on the shape type. To display no label, specify Label as "".

    Drawing mode, specified as one of these options :

    • "single" — Block the MATLAB® command line until you draw one shape.

    • "single-accept" — Block the MATLAB command line until you draw and accept one shape.

    • "multiple" — Block the MATLAB command line until you draw and accept multiple shapes.

    For example, DrawMode="multiple" enables drawing multiple shapes before returning control to the MATLAB command line. When you specify Position, the function creates the shape programmatically and does not block the MATLAB command line.

    Output Arguments

    collapse all

    Added shape, returned as a shape object or an M-element array of shape objects. The type of object or objects returned in roi depends on the value of the shape argument and returned as one of:

    • Points — Points object

    • Lines — Lines object

    • Polyines — Polylines object

    • Cuboids — Cuboids object

    • Angles — Angles object

    • Elevations — Elevations object

    • Circles — Circles object

    • Freehand — Freehand object

    Version History

    Introduced in R2026b