Get Started with Polyspace Test Using Example Project
Polyspace® Test™ provides tools for developing, managing, and executing unit and integration tests for C and C++ code in embedded systems. You can create tests in a graphical user interface or using a C/C++ xUnit-based API and author stubs or mocks to isolate and verify code under test. Polyspace Test lets you execute tests on host computers or embedded targets, automate test execution, and link tests to requirements for traceability. You can also perform code coverage analysis to measure test completeness with metrics such as decision, condition, and modified condition/decision coverage (MC/DC). You can use automatic test generation to achieve desired code coverage, test boundary values, and extend requirements-based test cases.
This tutorial helps you explore the capabilities of Polyspace Test using an example project. Alternatively, you can create a project using sample source files and author tests from scratch. For a step-by-step tutorial on test authoring, see Write C/C++ Unit Tests in Polyspace Platform User Interface.
Open Polyspace Platform User Interface
To open the Polyspace Platform user interface, double-click the desktop shortcut Polyspace Test R2026a. If you have not added a desktop shortcut during installation, double-click or otherwise start the following executable:
polyspaceroot\polyspace\bin\polyspace-desktop-ui.exe
polyspacerootC:\Program Files\Polyspace\R2026a.Check Compiler Setup
To analyze your source files and later build them, you require a compiler. If you have a supported compiler installed, it is automatically detected (except for MinGW, which requires additional setup). To see if a compiler has been detected:
On the toolstrip, select Settings.
On the Testing and Profiling tab, check the option C/C++ Host Compiler to see if a compiler has been detected.
This compiler is used during code analysis and project build on the host computer.
For more information on supported compilers, see Supported Host Compilers. If you are using Polyspace
Test on Windows® without a compiler previously installed, install MinGW in a path without spaces and set the environment variable MW_MINGW64_LOC to your install folder.
To install a supported MinGW version, select the link
Download MinGW 8.1in Support for MinGW-w64 C/C++ Compiler.For things to try if a compiler is not detected, see Troubleshoot Missing Compiler Error.
Most desktop Linux® distributions have GNU® C (GCC) installed by default and do not require additional setup for Polyspace Test.
Note that a supported compiler is required only to compile code generated by Polyspace Test during the build process. For compiling your sources and tests, you can continue to use any compiler that you are already using. For more information, see Specify C/C++ Compilers for Testing in Polyspace Platform User Interface.
Open Example Project
Open an example project in the Polyspace Platform user interface.
On the Start Page pane, in the Examples section, click the link Create and run functional tests.
This action loads the example project,
Demo_C_PS_Test.psprjx, on the Projects pane.On the Polyspace Platform toolstrip, select Parse Code.
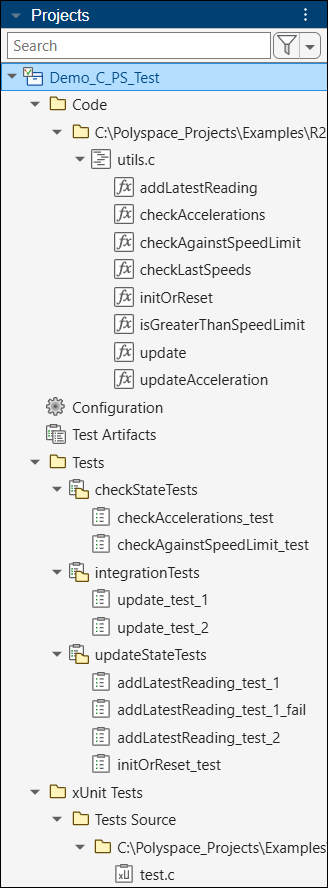
On the Projects pane, you see function names appear under the Code node of the project.
Explore Sources
The example project, Demo_C_PS_Test.psprjx contains one source file, utils.c. The source file includes a header file, types.h, that defines a structured type, ecoCarState. All functions in the source file operate on an argument of this type and initialize, read, or update the argument.
To see the source file, double-click
utils.cunder the Code node of the project.You can see the definitions of all functions in
utils.c.To see the header file and the definition of the
ecoCarStatestructure:On the Polyspace Platform toolstrip, select the Code Explorer
 button.
On the Code pane, you can see the name
types.hlisted under the Sources node below Files Included. Click the file name to open the file.
You can see the definition of the structure
ecoCarState.
Explore Simple Tests
In a simple test, you invoke one function to test. You specify inputs to the function and following the function invocation, assess the function return value or function arguments passed by pointer.
For simple types, you specify the input and assessment values in the Inputs and Assessments section of the test.
For pointer types, you specify a target for the pointer in the Inputs and Assessments section, and the target values in the Test Data section of the test header.
On the Projects pane, you can find all tests under the Tests node of the project. Double-click the test name addLatestReading_test_1 in the test suite updateStateTests. This test invokes the function addLatestReading(ecoCarState*, uint32_t) with the following inputs:
The first input of type
ecoCarState*points to a targetinput_target_myEcoCarState. The target values are defined in the test header in the Test Data section.The second input of type
uint32_thas the value 10.
After the function invocation, the test assesses if the value of type ecoCarState passed by pointer now corresponds to a target assessment_target_myEcoCarState. The target values are again defined in the test header in the Test Data section. You see that the value 10 from the uint32_t input has been added to arrays inside the target.
The tests checkAccelerations_test, initOrReset_test, update_test_1, and update_test_2 are likewise simple tests that invoke a single function and assess values after the function invocation. Double-click any of these tests to explore further.
For more information on test inputs and assessments, see Inputs, Assessments, Stubs and Mocks.
Explore Multistep Tests
In a multistep test, you invoke several functions to test in separate steps (or you can invoke the same function several times). You can assess values after each invocation, or in the last step after all the function invocations.
Double-click the test name addLatestReading_test_2 in the test suite updateStateTests under the Tests node of the project. This test invokes the function addLatestReading(ecoCarState*, uint32_t) four times in four different steps:
Step_ID1Step_ID2Step_ID3Step_ID4
In the test case editor, select each step on the left to update the Step section of the test on the right.
Notice that only the value of the second input of type uint32_t varies between the steps. The first input of type ecoCarState* continues to point to the same target in all steps. In other words, the same target is being updated in all four steps.
Only the fourth step Step_ID4 contains an assessment. This step assesses that the value of type ecoCarState passed by pointer in all four steps now corresponds to a target exp_tgt_myEcoCarState. The target values are defined in the test header in the Test Data section.
For more information on multistep tests, see Write Multistep Tests in Polyspace Platform User Interface.
Explore Parameterized Tests
If you want to test the same function with different input values, instead of writing separate tests, you can write a single test where the inputs and assessments are assigned to parameters instead of constant values.
Double-click the test name checkAgainstSpeedLimit_test in the test suite checkStateTests under the Tests node of the project. This test invokes the function checkAgainstSpeedLimit (uint32_t, uint32_t) with the following inputs:
The first input of type
uint32_tis parameterized. In other words, instead of a constant value, the first input takes a parameterparam_speedReading, whose values are defined in the test header in the Test Parameters section.The second input of type
uint32_ttakes the constant value 70.
The return value of the function, pst_call_out, in the assessment is also assigned to a parameter param_pst_call_out. The values of this parameter are also defined in the test header in the Test Parameters section.
A parameterized test leads to the test being repeated multiple times, each time with a different value of the parameter. The parameterized test in this example follows a sequential strategy, which means that the first parameter value of param_speedReading corresponds to the first value of param_pst_call_out, the second value of param_speedReading corresponds to the second value of param_pst_call_out,
and so on.
For more information on parameterized tests, see Run Same Test with Different Inputs in Polyspace Platform User Interface.
Explore Requirements Linking
You can link tests to requirements in a requirements document written in PDF, HTML, Word, or another format.
Each test in the example project is linked to requirements defined in a requirements document. For instance, the test addLatestReading_test_1 satisfies the following requirement:
Each speed reading must update the record that keeps track of the last ten speed readings.Double-click one of the tests under the Tests node of the project and open the test.
Click the link in the Requirements field in the test header.
For more information on requirements linking, see Link C/C++ Sources and Tests to Requirements.
Build and Run Tests
After authoring your tests, you can build and run them using the specified compilation toolchain:
On the Project tab of the Polyspace Platform toolstrip, select Build Project. You can follow the progress of project build on the Logs pane.
If your compilation toolchain has been set up previously, the example sources and tests build successfully using the specified toolchain. In this example, you see a single build warning about a function not supported for graphical test authoring. You can see from the function definition that the unsupported function is a
staticfunction. Since the function is not supported for test authoring, it does not appear on the Projects pane. To see the function, select Code Explorer on the Polyspace Platform toolstrip. For more information on functions not supported for test authoring, see Functions and Data Types Not Supported for Graphical Test Authoring in Polyspace Platform User Interface.After project build, right-click the Tests node of the project and select Run Tests. On the Results pane, located below the Projects pane, you can see a new Tests node corresponding to the test results.
Right-click the Tests node on the Results pane and select Open Review.
You see that all except one test has passed successfully. The project contains one failing graphical test
addLatestReading_test_1_fail.
For more information on building projects and opening test results, see:
Compute Code Coverage
Using Polyspace Test, you can compute how much of your code is covered by existing tests:
On the Polyspace Platform toolstrip, select Project to return to the project perspective.
In the project perspective, on the toolstrip, instead of No Profiling, select Code Coverage. Rebuild your project. The project build takes longer than earlier because the sources are instrumented for code coverage before build.
After project build, rerun the tests. On the Results pane, you see a Coverage node in addition to the previous Tests node.
Right-click this node and select Open Review. After expanding the nodes corresponding to file names, you see that some decisions in these functions are not covered by the tests:
checkLastSpeedscheckAgainstSpeedLimitisGreaterThanSpeedLimit
Right-click the Coverage node on the Results pane and select Show in Explorer. This action opens your file explorer to the location of the coverage results (.psprof) file. You will have to provide the path to this file in the next section.
For more information on calculating code coverage and reviewing results, see:
Generate Tests Automatically for Missing Coverage
You can automatically generate tests to cover functions, decisions, and conditions that are not covered by existing tests:
On the Polyspace Platform toolstrip, select Project to return to the project perspective.
On the Projects pane, right-click the function
checkLastSpeedsand select Generate Tests (coverage metrics).In the test generation window:
Clear Restrict to function.
Select Add tests for missing coverage. Navigate to the location of the
.psproffile created in the previous section and provide the full path to the file (including the file name).
Click Generate. This action generates tests for the function
checkLastSpeeds (ecoCarState*, uint32_t).Enter values in the Assessments section of the generated tests (you can leave the default value 0 for the purposes of this example).
Recalculate coverage using the same steps as in the previous section. You see that all functions other than isGreaterThanSpeedLimit have been covered by the tests.
For more information on test generation, see:
Justify Missing Coverage Using Static Analysis Results
Sometimes, a branch of code cannot be covered even by generated tests because the branch is statically unreachable. You can use static analysis results from Polyspace Bug Finder™ or Polyspace Code Prover™ to find unreachable branches of code, and import the static analysis results into your coverage results to automatically justify missing coverage of the unreachable branches of code.
The function isGreaterThanSpeedLimit that is not covered by the generated tests has an if condition that is always true. Therefore, the false outcome of this condition cannot be tested. You can use results of static analysis to detect such unreachable/dead code and automatically justify the missing coverage:
If you are in the results perspective, select Project on the toolstrip to return to the project perspective.
In the project perspective, on the Polyspace Platform toolstrip, click the arrow below Find Defects and select Prove Absence of RTEs.
After analysis, you see an RTE node on the Results pane. Right-click this node and select Show in Explorer. This action opens your file explorer to the location of the static analysis results (
.pscp) file. You will have to provide the path to this file in the next step.Reopen the coverage results from the previous section.
On the toolstrip, click the arrow below Import and select Import Unreachable Code Results. Navigate to the previously located static analysis results file and open the file. You see that all decisions in all functions in the example are now covered or justified. Justified items appear in blue on the Results List pane.
For more information on missing coverage justification using static analysis results, see Justify Missing Coverage Using Results from Polyspace Static Analysis.
Explore Tests Written Using C/C++ xUnit API
In addition to graphical tests, the example project Demo_C_PS_Test.psprjx contains tests authored using the Polyspace
Test xUnit API.
On the Projects pane, you see tests authored in C/C++ under the xUnit Tests node of the project. To see the test definitions, double-click the file test.c under the xUnit Tests > Tests Source node of the project.
After you build your project, each test is compiled into a test executable that appears under the xUnit Tests > Tests Executable node of the project.
To run a single test, right-click a test executable name and select Run Test.
To run all tests, right-click the Tests Executable node and select Run Tests.
For more information on test authoring using the C/C++ xUnit API, see: