Get Started with ROS 2 Network Analyzer App
This topic shows how to connect to a ROS 2 network, analyze essential information about all the elements in the network graph such as node name and information about the message between the nodes, and visualize the interaction between the parameters associated with the ROS 2 nodes such as topics, services and actions.
Connect and View ROS 2 Network
Open ROS 2 Network Analyzer app from the Apps tab in MATLAB® toolstrip.
To connect to a ROS 2 network, click Connect from app toolstrip.
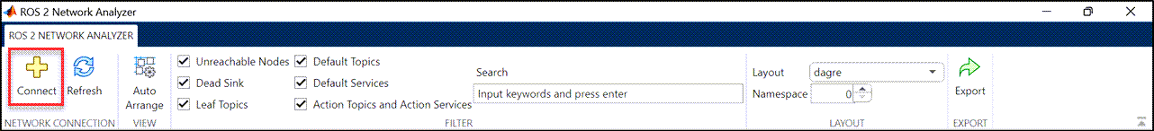
Provide ROS 2 Domain ID and click Submit. The default domain ID is 0. This opens the network graph in the visualizer.
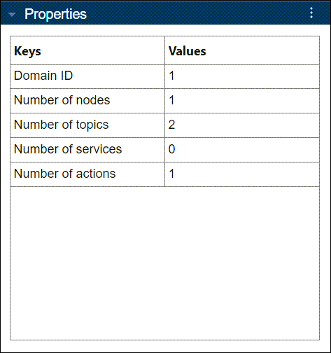
View the list of different elements in the Network Browser panel and their numbers in the Properties panel along with the Domain ID of the connected ROS 2 network. Select or clear any of these elements from the Network Browser to view or hide them from the graph.
Network Browser Properties 
Nodes — Lists all nodes in the connected ROS 2 network

Topics — Lists all topics published and subscribed by each node in the connected ROS 2 network

Services — Lists all services that a node provides (service-server) and for which a node is a client (service-client)

Actions — Lists all actions that a node provides (action-server) and for which a node is a client (action-client)
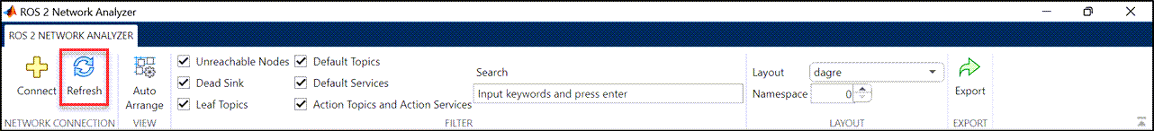
Click Refresh to update the ROS 2 network graph with newly added or removed nodes and all the node elements in the Network Browser and Properties respectively.
Interact with Network Graph
Zoom in or zoom out by pinching in or pinching out, or click and hold to pan around the graph based on the visual requirements.
Use the mini map at the bottom left corner of the visualization window to get a complete overview of a large network, highlighting the currently visible section. You can click anywhere on the mini map to pan around the network graph, ensuring ease of navigation, and choose to view the section you need.
Select any element in the visualization graph to view all its details in the Properties panel.
You can also click and drag these elements across the visualization window for ease of view. To bring the network graph back to its initial view, click Auto Arrange.
Elements Properties Node 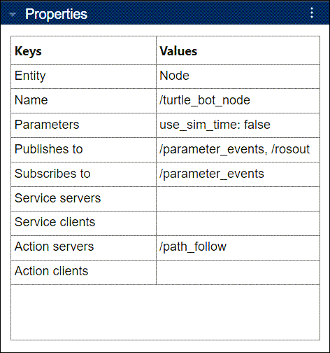
Publisher 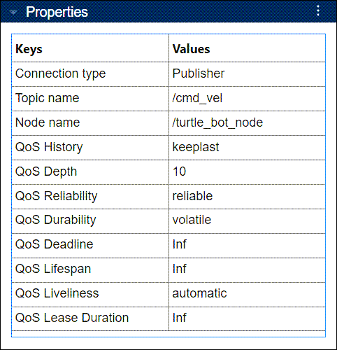
Subscriber 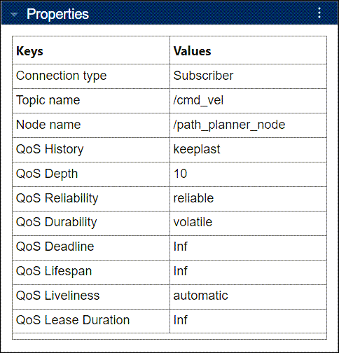
Topic 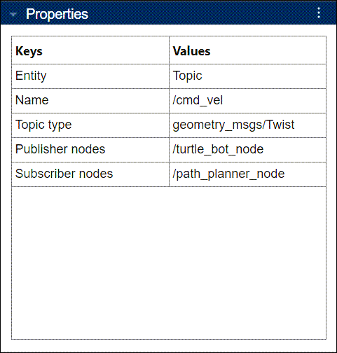
Service 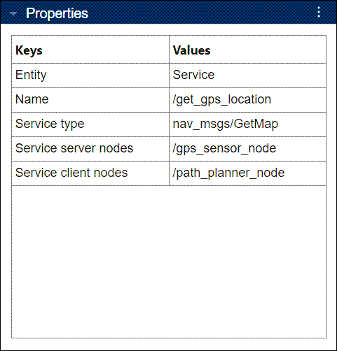
Action 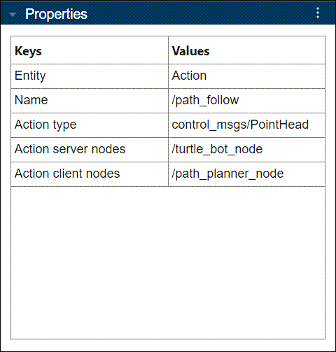
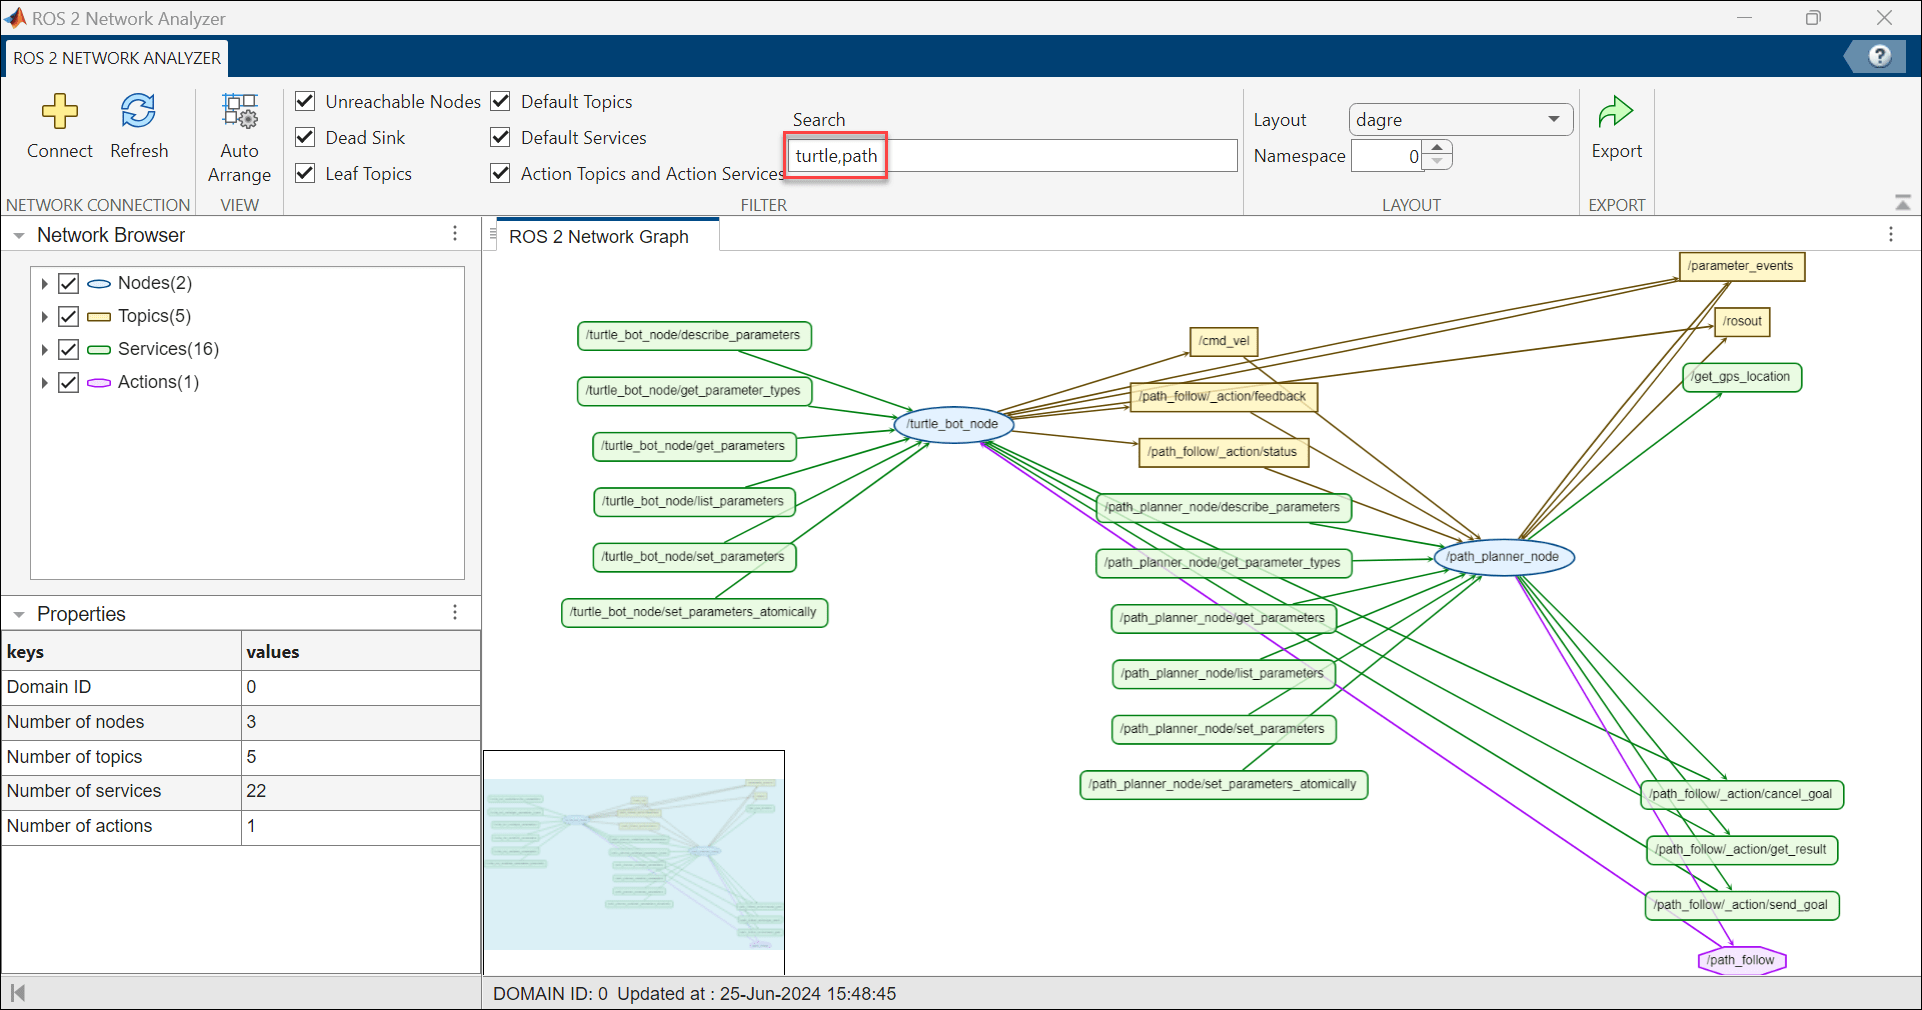
You can right-click and copy the name of any element from the network graph or any value from the Properties panel and use it as a keyword to search across all elements in a big network.
Filter and Search Elements
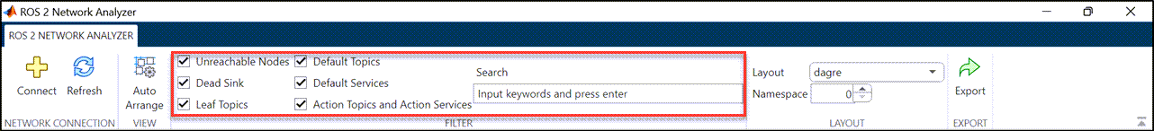
Select or clear these filters to view or remove them from the network graph.
| Filter Options | Descriptions |
|---|---|
| Unreachable Nodes | This constitutes of nodes that:
|
| Dead Sink | This constitutes of topics which have subscribers and no publishers. |
| Leaf Topics | This constitutes of topics which have publishers and no subscribers. |
| Default Topics | This constitutes of default topics related to ROS 2 network:
|
| Default Services | This constitutes of default services related to ROS 2 network:
|
| Action Topics and Action Services | This constitutes of default topics and services related to actions in the ROS 2 network:
|
Apply Advanced Filters and Search
The Advanced Filters option is enabled by default in the app toolstrip. It includes an Advanced Filter By drop-down at the top of the network canvas, which allows you to filter between network entities individually or collectively.

Use the advanced filtering capability to efficiently filter Nodes, Topics, Services, and Actions associated with selected entities in the Network Browser pane for a connected ROS 2 network. You can select these elements without having to input complete names.
To filter based on message, service, and action interface types, select Message Types from the list. When you choose this option, the app automatically clears the other selections and disables all the other options in the list. This functionality enables you to focus on message, service, and action types.
To tailor the network to your requirements, enter any of these expressions in the Search box and click Apply Filters:
Keyword — Include entities that contain specific words, such as camera or GPS.
Regular Expression — Match entities using patterns such as
.*camera.*orgps.*for flexible searching.Exclude — Use ~ before a keyword to exclude entities, such as
~debugand~camera.Multiple Inputs — Enter multiple filters by separating them with commas.
You can specify the Network Depth value to modify the number of neighboring entities visible for a selected entity in the graph.
Click Clear Filters in the network canvas to remove all the advanced filters and reload the default graph.
For more details on the Advanced Filter By dropdown and how
to use this functionality for developing applications, see the Use Advanced Filtering in ROS 2 Network Analyzer for Large Network example.
Arrange Network Layout
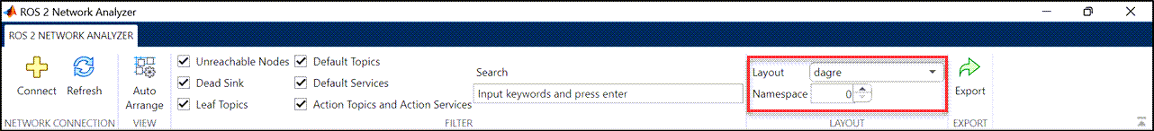
Layout — Use this feature to arrange the network graph layout using one of these options.
Name Description Applications View dagreDirected layout that creates an inverted V shape of the graph elements and their edges from one level to the next. dagrelayout respects flow of information or progression through stages when elements in the network graph have a clear flow direction.Use this approach to clearly visualize the directional relationships and dependencies between elements.
breadthfirstHierarchical layout that organizes the graph elements according to the levels generated by running a breadth-first search on the graph. breadthfirstlayout arranges graph elements level by level or layer by layer from a specified root element when there is a large graph that can lead to excessive overlap between the elements.Use this approach to horizontally align all elements at the same depth from the root, which makes it useful for understanding breadth or depth within a graph's structure.
coseForced-directed layout that emphasizes on group and tree structures to minimize edge crossings and evenly distributes graph elements. coselayout emphasizes element groupings in the graph through spatial proximity, particularly effective for compound graphs that have nested structures.Use this layout to visually distinguish clusters and relationships between graph elements within complex networks.
circleGeometric layout that organizes the graph elements into a circle. By default, the elements are placed clockwise from the 12 o’clock position, in the order that they are passed to the layout. circlelayout places graph elements equidistantly along the circumference of a circle and highlight the density of edges connected to different elements, especially when the edges are made semitransparent.Use this approach to visualize the overall connectivity and identifying patterns or clusters based on the concentration of edges within the graph.
gridDefault layout that easily shows all elements in the graph by positioning all of them at the origin. gridlayout visually verifies that the graph has correctly loaded, and the graph elements are organized n a structured and uniform manner.Use this layout to quickly identify anomalies in the data or layout issues, making it easier to ensure the integrity and completeness of the graph's visualization.
concentricGeometric layout that organizes the elements into concentric circles, based on the specified metrics such as hierarchy level or connectivity degree, placing elements with the highest metric values in the innermost circle and descending their metric values with each outward circle. concentriclayout highlights the relative importance of the elements when a clear visualization of hierarchical levels or layers around a central point is required.Use this layout to effectively emphasize the centrality and hierarchical structure within a network, facilitating an intuitive understanding of the relationships and importance among the graph elements.
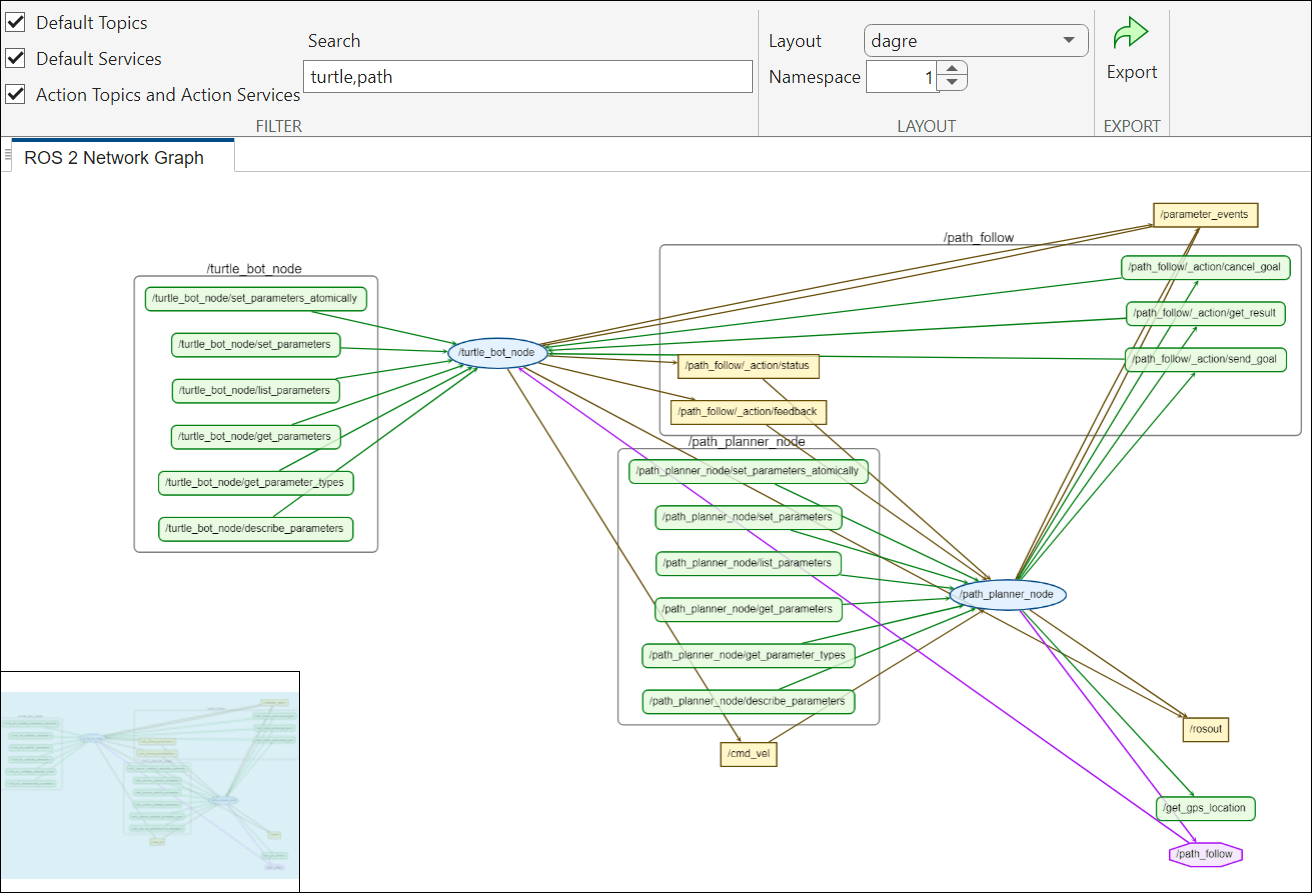
Namespace — Use this option to organize the nodes, topics, services, and actions into clusters or groups based on their namespace, which perform similar functions but operate in different contexts or areas of the application.
A namespace is a hierarchical prefix extracted from the names of nodes, topics, services, and actions to logically organize and classify the components within these elements into clusters or groups. These clusters can be nested within each other, allowing for multiple levels of organization. The depth of the namespace determines the level of granularity in the clustering.
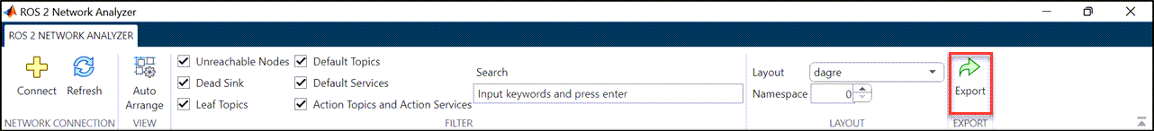
Export Network Snapshot
To export the ROS 2 network graph snapshot as an image, click Export on the app toolstrip.
Examples
Create and Visualize ROS 2 Network for Robot Navigation
This example shows how to set up a basic ROS 2 network for robot navigation and visualize all the node information using the ROS 2 Network analyzer app.
Define the action type, topic type, service type, and domain ID to initialize a ROS 2 network for robot navigation.
actionType = 'control_msgs/PointHead';
topicType = 'geometry_msgs/Twist';
svcType = 'nav_msgs/GetMap';
domainId = 0;
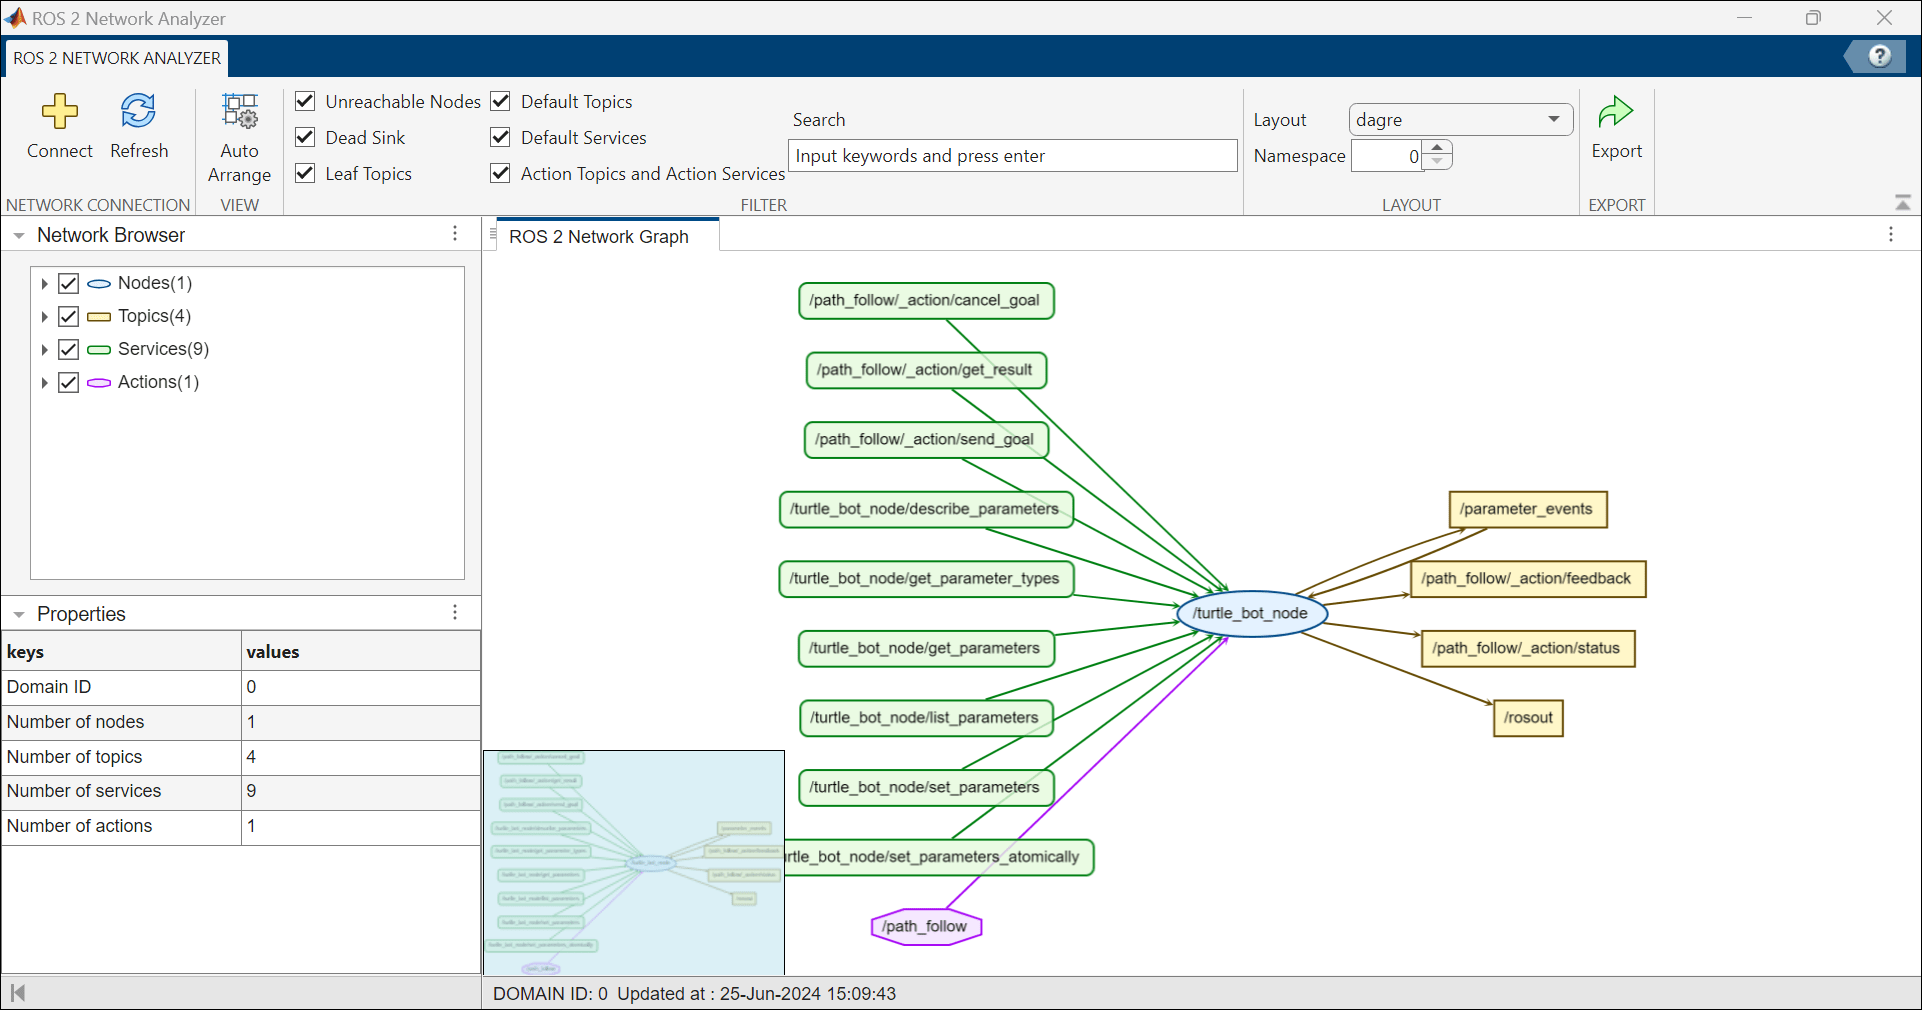
Create a ROS 2 node for Turtlebot robot with the specified domain ID.
turtleBotNode = ros2node('/turtle_bot_node', domainId);Initialize an action server to handle path following requests.
actionServer = ros2actionserver(turtleBotNode,'/path_follow',actionType, ...
                ExecuteGoalFcn=@(~,~,~,defaultResult) deal(defaultResult, true));
Open the ROS 2 Network Analyzer app from Apps tab in MATLAB® toolstrip to visualize the ROS 2 network.
You will see that the Unreachable Nodes, 'Dead Sink' and 'Leaf Topic' filters are checked by default. Check the remaining filters too to have a comprehensive view of the ROS 2 network.
Create a ROS 2 node for the GPS sensor and set up a service server that responds with GPS location data.
gpsNode = ros2node('/gps_sensor_node',domainId);
srv = ros2svcserver(gpsNode,'/get_gps_location',svcType,@(~,resp)resp);
Create a ROS 2 node for handling the path planning tasks with the specified domain ID.
plannerNode = ros2node('/path_planner_node',domainId);Establish a service client to obtain GPS locations on the planner node and an action client to send the path following requests.
svcClient = ros2svcclient(plannerNode,'/get_gps_location',svcType);
actClient = ros2actionclient(plannerNode, '/path_follow',actionType);
Create a subscriber to listen for velocity commands to control the robot's movement.
sub = ros2subscriber(plannerNode,'/cmd_vel',topicType);Set up a publisher for sending commands over the '/cmd_vel' topic.
pub = ros2publisher(turtleBotNode,'/cmd_vel',topicType);Now open the ROS 2 Network Analyzer app interface and click Refresh to visualize the updated ROS 2 network.
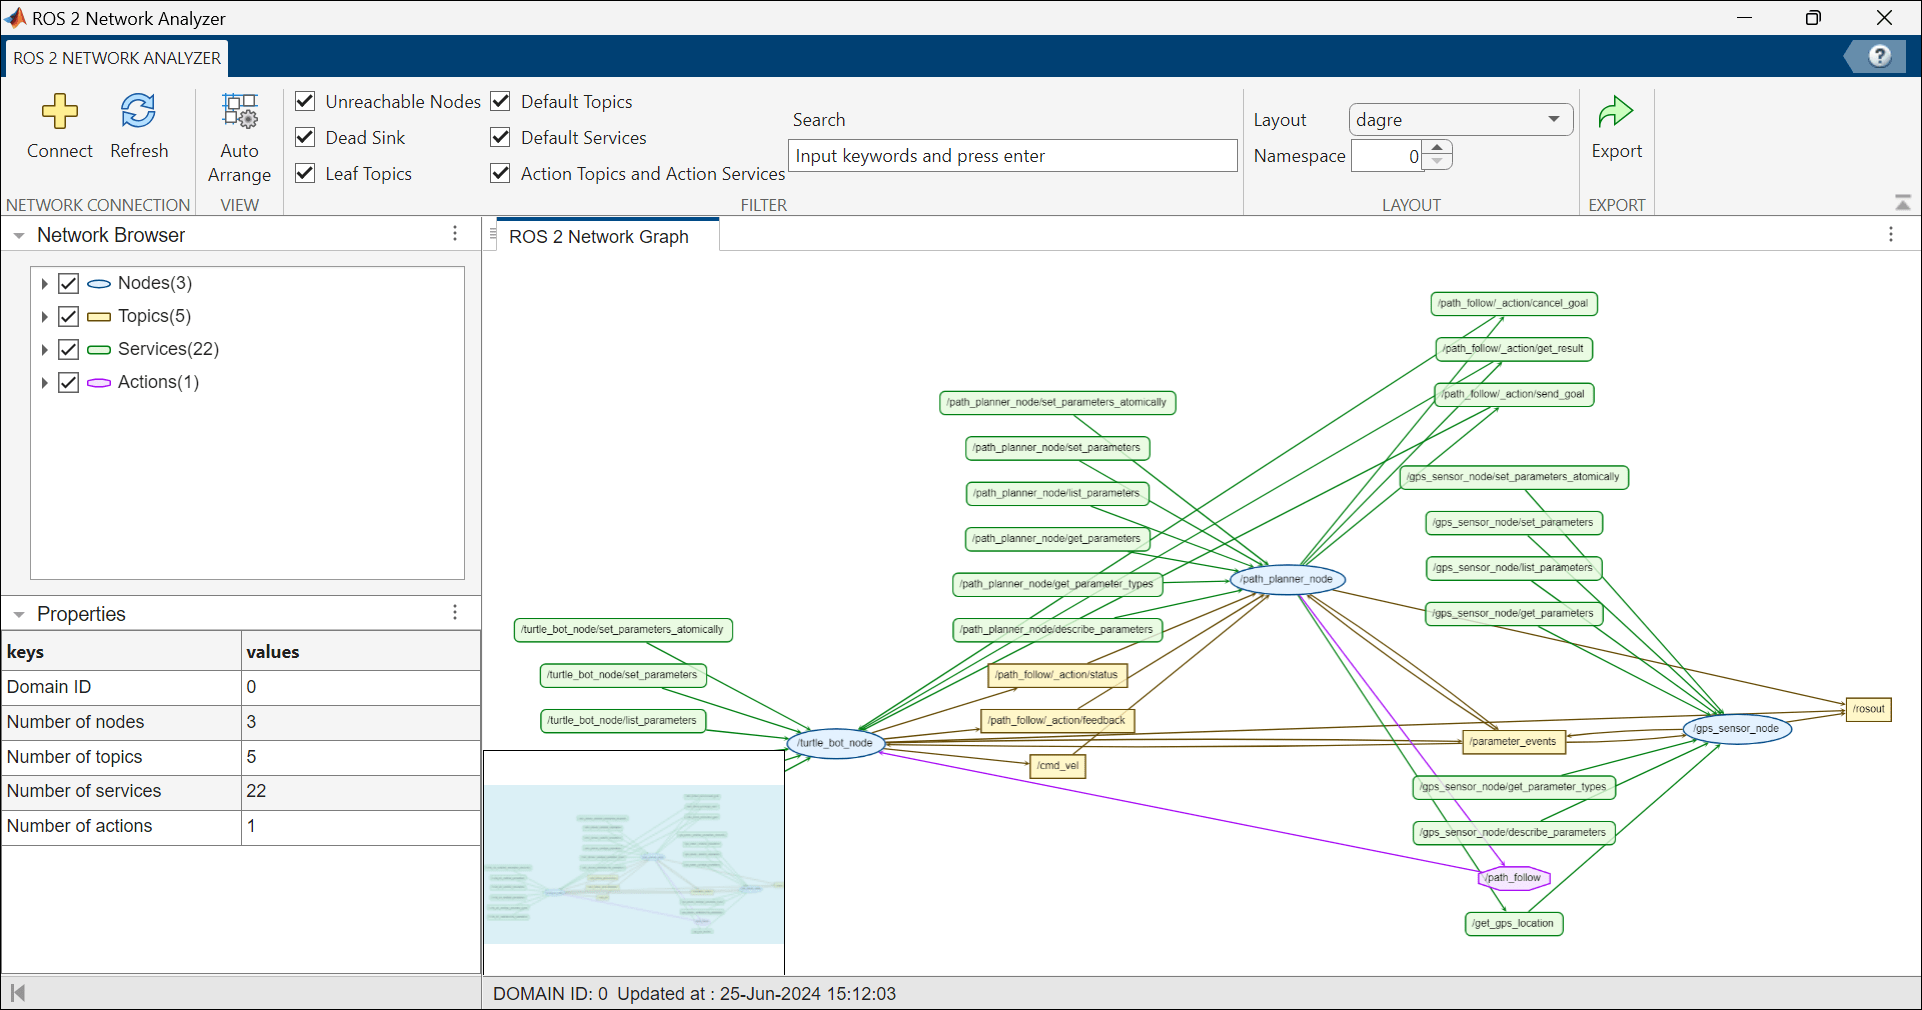
Use the minimap to pan around the network graph for better visibility of the default services related to the /turle_bot_node. You can also click and drag these elements across the visualization window for ease of view. To bring the network graph back to its initial view, click Auto Arrange.
To group all the elements into clusters or groups based on their namespace, use Namespace. The depth of the namespace determines the level of granularity in the clustering. For example, Namespace field set to 1 organizes all the elements into 4 clusters — /turtle_bot_node, /path_follow, /path_planner_node, and /gps_sensor_node.
To increase the granularity in clustering, set Namespace to a higher value such as 2. This adds another level of granularity with a nested cluster such as /path_follow_action under /path_follow.
Use Advanced Filtering in ROS 2 Network Analyzer for Large Network
This example shows how to use advanced filtering in the ROS 2 Network Analyzer app to analyze a network designed for a lane driving scenario in autonomous vehicles. The network includes nodes and topics relevant to perception, planning, and behavior management in lane based driving systems.
Load ROS 2 Network
Open and run the exampleHelperROS2GenerateLargeNetwork MATLAB® script to generate a large ROS 2 network demonstrating a lane driving scenario.
open("exampleHelperROS2GenerateLargeNetwork.m")
This network consists of:
Nodes for perception, planning, behavior control, and robot state publishing such as
traffic_light_recognition,behavior_velocity_planner, androbot_state_publisher.Topics to facilitate sensor data exchange, path planning, and debugging visualization such as
/sensing/camera/camera6/camera_info,/planning/path_reference/lane_change_left, and/planning/debug/objects_of_interest/traffic_light.Services to provide dynamic control over specific planning and perception functionalities such as
/planning/enable_auto_mode/intersectionand/perception/traffic_light_recognition/traffic_light_arbiter/container/_container/load_node.
Open ROS 2 Network Analyzer from the Apps tab in MATLAB toolstrip. Click Connect in the MATLAB toolstrip to connect to a ROS 2 network. Set ROS 2 Domain ID to 1 and click Submit. The app opens the network graph in the visualizer.
Open Advanced Filters
Use the Advanced Filters option to efficiently filter nodes, topics, services, and actions associated with selected entities in the Network Browser for the connected ROS 2 network. This option is enabled by default in the app toolstrip.
Locate the Advanced Filter By drop-down list at the top of the network canvas to select the filtering mode based on your requirement, such as Nodes, Topics, Services, Actions, or Message Types.

Filter Traffic Light Entities
To visualize the interaction of network entities associated with traffic signal recognition module, enter the keyword traffic_light in the Search tab and click Apply Filters.
You can see that the network graph now highlights entities such as:
/perception/traffic_light_recognition/traffic_light_multi_camera_fusion/perception/traffic_light_recognition/traffic_light_arbiter/container/planning/debug/objects_of_interest/traffic_light/perception/traffic_light_recognition/camera6/classification/traffic_signals
You can also view non-traffic light nodes on the canvas that are immediate neighbors of the filtered traffic light nodes, as the default value of Network Depth is set to 1.

Exclude Debug Topics
To further filter the network to exclude debug-related entities, simplifying the view and focusing on operational nodes, enter ~debug in the Search tab and click Apply Filters. Using ~ excludes entities containing debug.
You can see that the network graph now hides entities such as:
/perception/object_recognition/tracking/multi_object_tracker/debug/objects_markers/perception/object_recognition/tracking/objects/debug/published_time

Focus on Sensor-Related Message
To exclusively filter the network to show entities exchanging messages of specific types, select Message Types from the Advanced filter By dropdown. You can use this feature to limit the graph to entities using message types such as:
sensor_msgs/JointStatesensor_msgs/Imagesensor_msgs/PointCloud
For example, to filter the network to shows entities exchanging messages specific to image sensors, enter sensor_msgs/Image in the Search tab, and click Apply Filters. Other entities such as nodes, services, and topics not using sensor_msgs are automatically excluded.

Clear Filters
To return to the default graph view, click Clear Filters on the network canvas. You can see that the entire network reloads, showing all nodes, topics, services, and actions.
Adjust Network Depth
Enter the keyword traffic_light in the Search tab and click Apply Filters again to filter all nodes, topics, and services associated with traffic lights. You will see that the depth of the network is set to 1 by default in the Network Depth option to restrict the graph to show immediate neighbors to simplify the visualization and focus on direct connections of filtered entities.

To adjust the view with two subsequent neighboring entities, set Network Depth to 2 and click Apply Filters.

Limitations
Quality of Services(QoS) information is available for topics only.
QoS history is not retrievable.