Main Content

si.MER

Reconstruct MER waveform and estimate MER statistical eye of nonlinear systems

Since R2024b

Description

Use si.MER to perform multiple edge response (MER) waveform reconstruction and estimate the MER statistical eyes of nonlinear systems. You can define the nonlinear system in one of two ways as a set of:

  • Exhaustive data patterns with the depth of Order+1, where Order is the MER order

  • Effective step responses

Creation

Description

mer = si.MER creates an object with reconstructed MER waveform and estimates the statistical eye.

example

mer = si.MER(Name=Value) sets properties using one or more name-value arguments. For example, mer = si.MER('Specification'='Wave','SourceWaves'='SourceWaves','SourceWavesPattern'='SourceWavesPattern') creates an object with reconstructed MER waveform and estimates the statistical eye from the input waveforms defined by 'SourceWaves' and 'SourceWavesPattern'.

Properties

expand all

MER order, specified as an integer ≥ 1.

Data Types: double

Number of pulse amplitude modulation symbol levels, specified as an integer ≥ 2.

Data Types: double

Time of a single symbol duration, specified as a real scalar in seconds.

Data Types: double

Number of samples within a single symbol time, specified as an even integer ≥ 4.

Data Types: double

Type of nonlinear system, specified as 'wave' or 'step'.

  • If you set Specification to 'wave', the object defines the system from the values of the SourceWaves and SourceWavesPattern properties.

  • If you set Specification to 'step', the object defines the system from the values of the SourceEffectiveSteps, SourceEffectiveStepsPattern, and SourceSymbolVoltage properties.

Data Types: char

Input waveforms defined by SourceWavesPattern, specified as a 2-D matrix.

Each column of the matrix defines the system response to the data pattern specified in each row of SourceWavesPattern. The property must have a uniform time step.

The object uses the SourceWaves property when you set the Specification to 'wave'.

Data Types: double

Symbol patterns, specified as a matrix whose elements are integers ranging from 0 to (Modulation − 1). This matrix defines SourceWaves.

Each row of the matrix represents a distinct pattern. There are Modulation(Order + 1) number of rows and Order + 1 number of columns.

To be functional, SourceWaves and SourceWavesPattern must contain all patterns from 0 to Modulation(Order+1) expressed in base Modulation integers. The base Modulation integers range from [0 0 ... 0] to [n n ... n], where n is (Modulation − 1).

The object uses the SourceWavesPattern property when you set the Specification to 'wave'.

Data Types: double

Channel delay, specified as an integer in samples. The object uses the SourceDelay property to correctly express the channel delay in the step responses calculated from SourceWaves.

The object uses the SourceDelay property when you set the Specification to 'wave'.

Data Types: double

Input MER step responses calculated outside the MER object, specified as a matrix.

The object uses the SourceEffectiveSteps property when you set Specification to 'step'. The property must have a uniform time step.

Data Types: double

Step response patterns of the input MER step responses, specified as a matrix.

The object uses the SourceEffectiveStepsPattern property when you set Specification to 'step'.

Data Types: double

Input symbol voltage for the input MER step responses, specified as a real scalar.

The object uses the SourceSymbolVoltage property when you set Specification to 'step'.

Data Types: double

Reference waveform to use to validate the reconstructed time-domain MER waveform, specified as a matrix.

Data Types: double

Data pattern of the reference waveform, specified as a vector of integers in the range [0, (Modulation−1)].

Data Types: double

Unit of measurement for axes in plot, specified as 'UI' or 'Seconds'.

Data Types: char

This property is read-only.

Labels for input source waveforms, returned as a text string.

This property is read-only.

Calculated MER step responses, returned as a matrix.

This property is read-only.

Calculated MER step response patterns, returned as a matrix.

This property is read-only.

Labels for output MER step responses, returned as a text string.

This property is read-only.

PAM symbol voltage levels of the system, returned as a vector.

This property is read-only.

Threshold between symbol voltage levels, returned as a vector.

This property is read-only.

Uniform time step of output waveforms, returned as a scalar.

This property is read-only.

Symbol pattern of output waveform created by makWave, returned as a matrix.

This property is read-only.

Estimated statistical eye, returned as a matrix.

This property is read-only.

Voltage data of the statistical eye matrix along the vertical axis, returned as a vector.

This property is read-only.

Time data of the statistical eye matrix along the horizontal axis, returned as a vector.

This property is read-only.

Symbol transition probability distribution functions (PDFs), returned as a matrix.

This property is read-only.

Patterns of the symbol transition PDFs, returned as a matrix.

This property is read-only.

Labels of the symbol transition PDFs, returned as a string.

This property is read-only.

Statistical eye diagram information, returned as a structure.

This property is read-only.

Aligned validation waveform, returned as a matrix

This property is read-only.

Difference between the aligned and reference waveforms, returned as a matrix.

This property is read-only.

Validation metrics, returned as a structure. This value helps you to determine if the MER order is sufficient to model the nonlinear system.

This property is read-only.

Reference waveform eye diagram information, returned as a structure.

This property is read-only.

Aligned waveform eye diagram information, returned as a structure. The MER wave is aligned with the reference wave.

This property is read-only.

Reconstructed MER waveform eye diagram information, returned as a struct.

Object Functions

makeWaveCreate symbol pattern waveform
estimateStateyeGenerate statistical eye from effective step responses
validateWaveCompare MER waveform to reference waveform
plotInputsPlot input waveforms and MER effective step responses
plotValidationPlot reconstructed, reference, and error waveforms
plotStateyePlot statistical eye of reconstructed MER waveform
plotPDFsPlot PDFs of MER waveforms

Examples

collapse all

Define the order and modulation of the nonlinear system.

Order = 1;        % For this example, you can vary the value of order between 1 to 4.
Modulation = 2;   % For this example, you can vary the value of modulation between 1 to 4.

Load the MAT files containing the simulation parameters.

matfilename = sprintf('MERExampleOrder%iModulation%i.mat',Order,Modulation);
load(matfilename)

Create the si.MER object.

mer = si.MER(...
    'Order', MERorder,...
    'Modulation', Modulation,...
    'SamplesPerSymbol', SamplesPerSymbol,...
    'PlotAxis', 'Seconds',...
    'SymbolTime', SymbolTime,...
    'Specification', 'Wave',...
    'SourceWaves', SourceWaves,...
    'SourceWavesPattern', SourceWavesPattern,...
    'SourceDelay', SourceDelay);

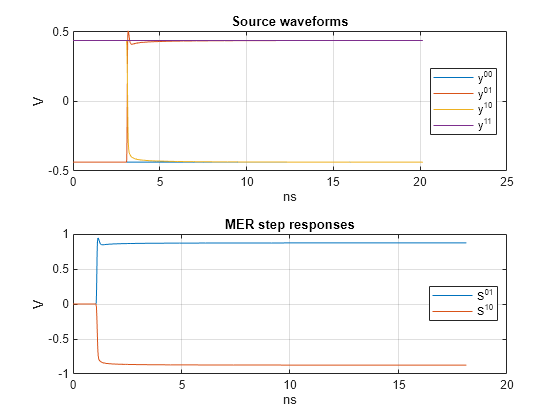
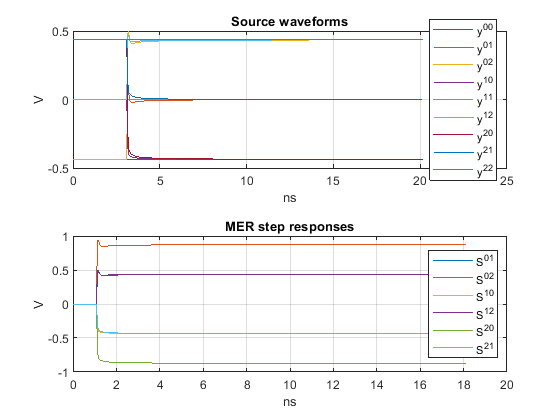
Visualize the inputs to the MER analysis by plotting them.

figure,plotInputs(mer)

Figure contains 2 axes objects. Axes object 1 with title Source waveforms, xlabel ns, ylabel V contains 4 objects of type line. These objects represent y^{00}, y^{01}, y^{10}, y^{11}. Axes object 2 with title MER step responses, xlabel ns, ylabel V contains 2 objects of type line. These objects represent S^{01}, S^{10}.

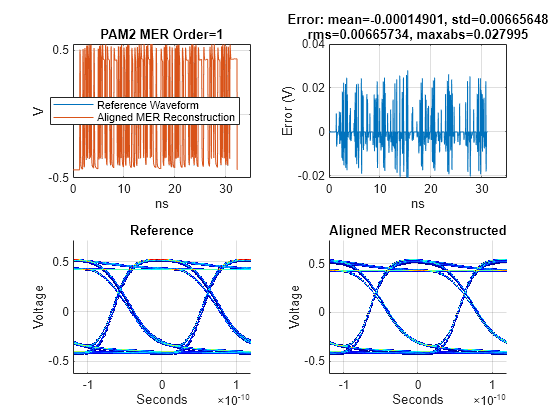
Ensure the generated waveforms are accurate by validating them against a reference wave.

figure,mer.validateWave(ReferenceWave,DataPattern,'plot','on')

Figure contains 4 axes objects. Axes object 1 with title PAM2 MER Order=1, xlabel ns, ylabel V contains 2 objects of type line. These objects represent Reference Waveform, Aligned MER Reconstruction. Axes object 2 with title Error: mean=-0.00014901, std=0.00665648 rms=0.00665734, maxabs=0.027995, xlabel ns, ylabel Error (V) contains an object of type line. Axes object 3 with title Reference, xlabel Seconds, ylabel Voltage contains an object of type image. Axes object 4 with title Aligned MER Reconstructed, xlabel Seconds, ylabel Voltage contains an object of type image.

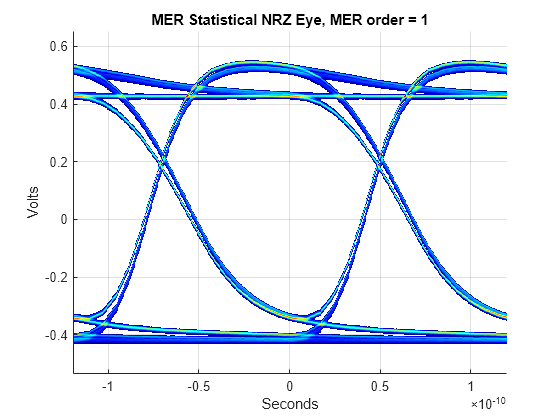
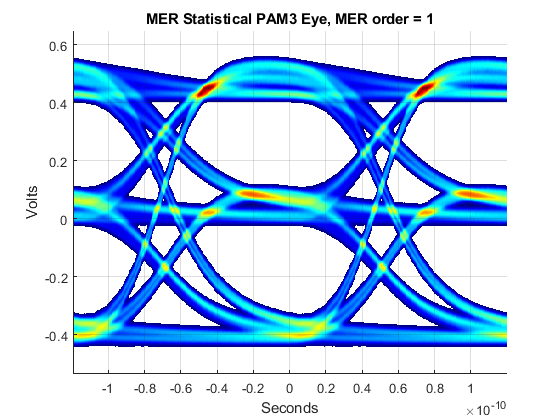
Plot the statistical eye.

figure,plotStateye(mer)
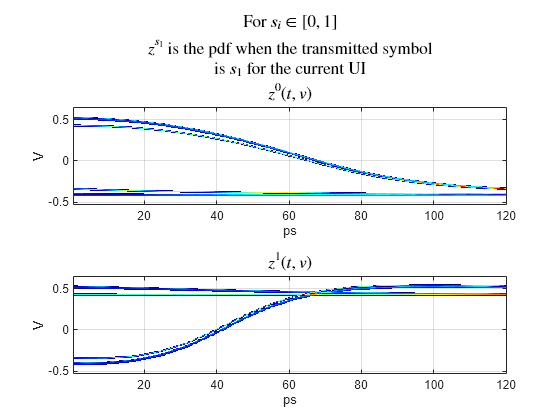
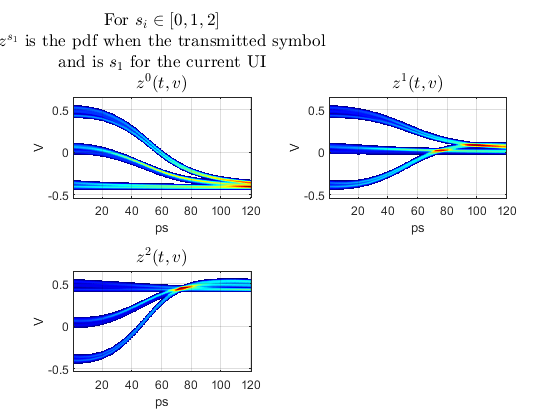
Figure contains an axes object. The axes object with title MER Statistical NRZ Eye, MER order = 1, xlabel Seconds, ylabel Volts contains an object of type image.

Plot the PDFs.

figure,plotPDFs(mer)

Figure contains 2 axes objects. Axes object 1 with title For s indexOf i baseline in bracketleft 0 , 1 bracketright z toThePowerOf s indexOf 1 baseline baseline is the pdf when the transmitted symbol is s indexOf 1 baseline for the current UI z toThePowerOf 0 baseline leftParenthesis t , v rightParenthesis, xlabel ps, ylabel V contains an object of type image. Axes object 2 with title z toThePowerOf 1 baseline leftParenthesis t , v rightParenthesis, xlabel ps, ylabel V contains an object of type image.

You can change the modulation level and MER orders to better reflect your nonlinear systems. For example, in a PAM3 modulation scheme and an MER of order 1, the input waveforms look as shown in this plot.

input_waveform.png

And the PDFs and estimated statistical eye looks as shown in these diagrams.

pdf.png

stat_eye.png

References

[1] Chou, Chiu-Chih, Sheng-Yun Hsu, and Tzong-Lin Wu. “Estimation Method for Statistical Eye Diagram in a Nonlinear Digital Channel.” IEEE Transactions on Electromagnetic Compatibility 57, no. 6 (December 2015): 1655–64. https://doi.org/10.1109/TEMC.2015.2457928.

[2] Ren, JiHong, and Kyung Suk Oh. "Multiple edge responses for fast and accurate system simulations." IEEE Transactions on Advanced Packaging 31, no. 4 (2008): 741–748.

Version History

Introduced in R2024b