Distortion Measurements
Generate 2048 samples of a sinusoid of frequency 2.5 kHz sampled at 50 kHz. Add white Gaussian noise such that the signal-to-noise ratio (SNR) is 80 dB.
Fs = 5e4;
f0 = 2.5e3;
N = 2048;
t = (0:N-1)/Fs;
SNR = 80;

x = cos(2*pi*f0*t);
x = x+randn(size(x))*std(x)/db2mag(SNR);
Pass the result through a weakly nonlinear amplifier represented by a polynomial. The amplifier introduces spurious tones at the frequencies of the harmonics.
amp = [1e-5 5e-6 -1e-3 6e-5 1 25e-3];
x = polyval(amp,x);
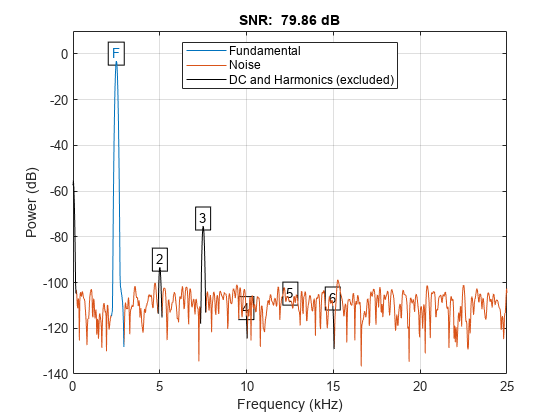
Plot the signal spectrum and annotate the SNR, verifying that it has the expected value. The snr function computes the power ratio of the fundamental to the noise floor and ignores the DC component and the harmonics.
snr(x,Fs);
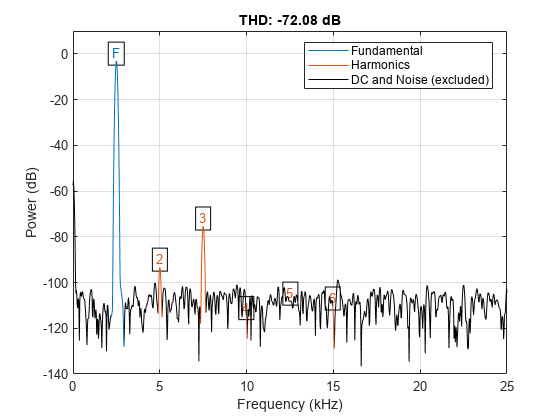
Plot the signal spectrum and annotate the total harmonic distortion (THD). The thd function computes the power ratio of the harmonics to the fundamental and ignores the DC component and the noise floor.
thd(x,Fs);
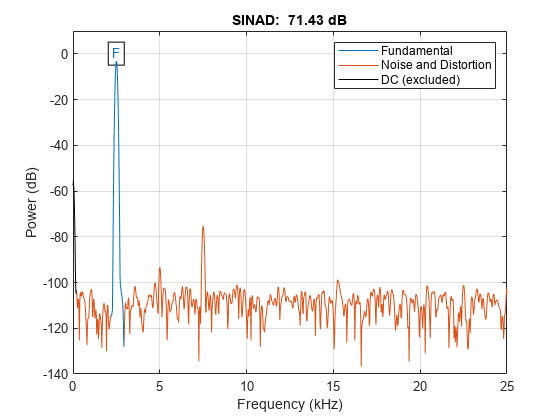
Plot the signal spectrum and annotate the signal to noise and distortion ratio (SINAD). The sinad function computes the power ratio of the fundamental to the harmonics and the noise floor. It ignores only the DC component.
sinad(x,Fs);
Verify that the SNR, THD, and SINAD obey the equation
lhs = 10^(-snr(x,Fs)/10)+10^(thd(x,Fs)/10)
lhs =
7.2203e-08
rhs = 10^(-sinad(x,Fs)/10)
rhs =
7.1997e-08
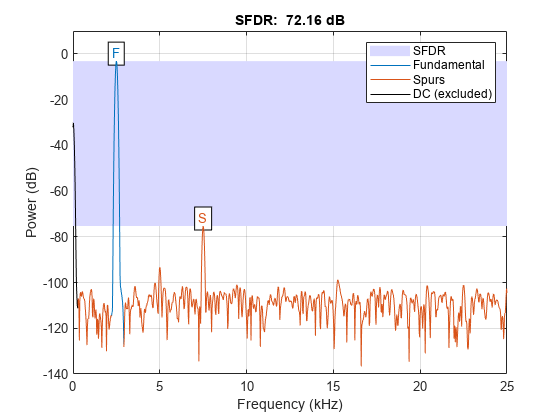
Plot the signal spectrum and annotate the spurious-free dynamic range (SFDR). The SFDR is the power ratio of the fundamental to the strongest spurious component ("spur"). In this case, the spur corresponds to the third harmonic.
sfdr(x,Fs);