Estimate Parameters Using Custom Weights and Group-Specific Doses in SimBiology Model Analyzer
This example shows how to use group-specific dosing data and custom numeric weights as you estimate parameters of a target-mediated drug disposition (TMDD) model based on experimental data.
Enter the following command to open the model and data in the SimBiology Model Analyzer app.
openExample('simbio/EstimateParametersCustomWeightsSimBiologyAnalyzerExample')
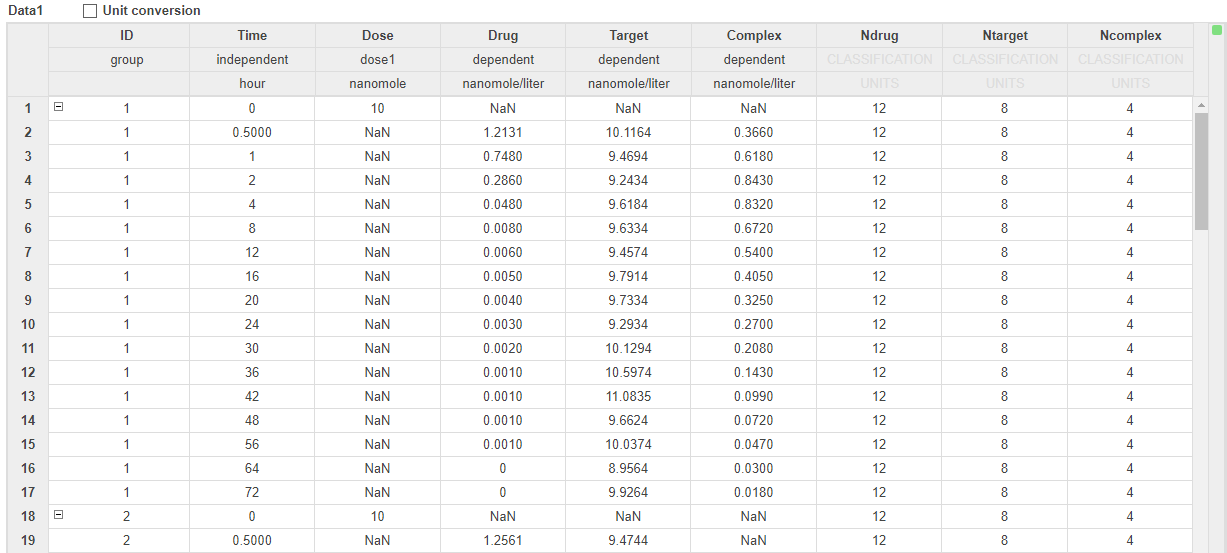
The data set comprises 12 groups of measurements across three responses: Drug, Target, and Complex. The Drug response includes measurements for all 12 groups, whereas the Target and Complex responses have measurements for only 8 and 4 groups, respectively. Ndrug, Ntarget, and Ncomplex columns represent the constant number of groups that have the measurements for the corresponding responses. Each group has its own dosing amount, represented by the Dose column.
In the Browser pane (if it is in the default Project View), expand the Data1 folder.
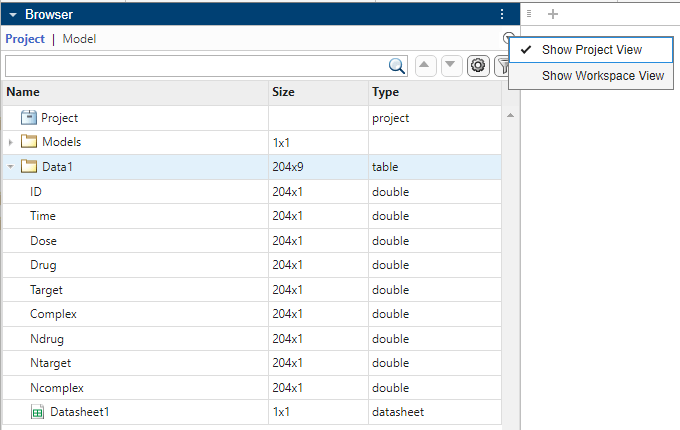
Then double-click Datasheet1 to open it.
Set up Fit Data program
To create a program to estimate parameters, on the Home tab, select Program > Fit Data. The program opens in the Program1 tab.
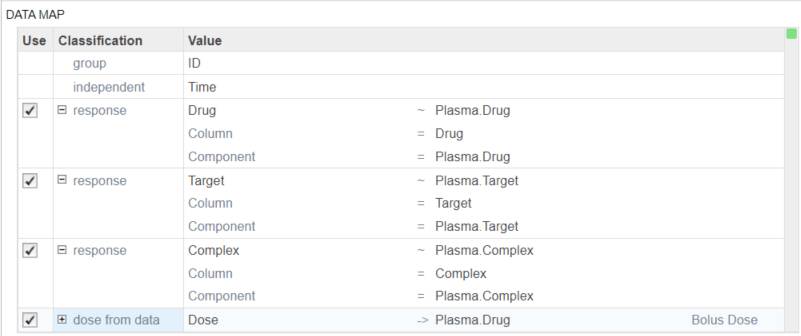
Scroll to the Data step of the program. In the Data Map table, add and map the following responses to the corresponding model components:
Drug to Plasma.Drug
Target to Plasma.Target
Complex to Plasma.Complex.
Dose to Plasma.Drug
Specify parameters to estimate
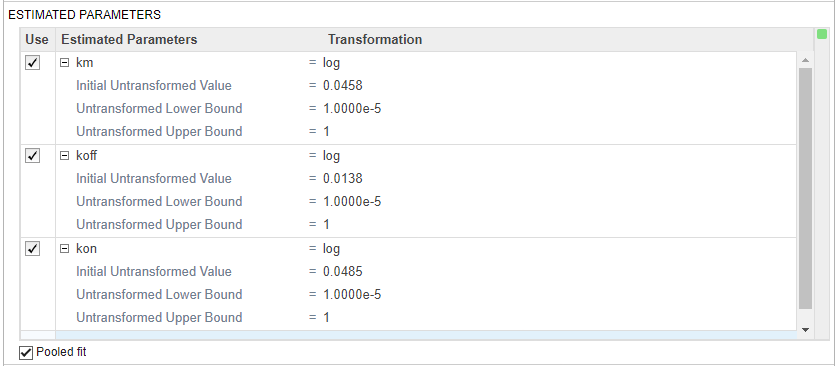
Scroll to the Fit step of the program. In the Estimated Parameters table, specify the following model parameters to estimate their values: km, koff, kon.
Also set the Untransformed Lower Bound and Untransformed Upper Bound to 1e-5 and 1, respectively.
Select Pooled fit to estimate one set of parameters for all groups.
Specify custom weights
In this data set, the response Drug has 12 groups of measurements, Target has 8 groups of measurements, and Complex has 4 groups of measurements. The varying number of measurements among these responses might stem from the experimental design. To address these differences, you might consider experimenting with weights that are inversely proportional to the number of measurement groups. The data contains Ndrug, Ntarget, and Ncomplex columns, which you can use to define your weights as such.
In the Error Model section, select Use weights for each response.
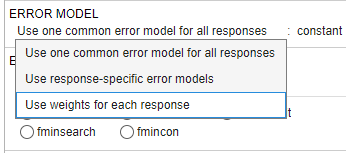
To see the built-in weight expressions, click the drop-down menu.
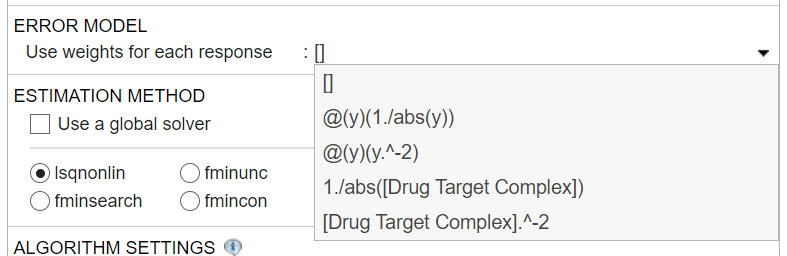
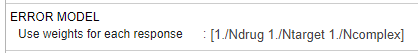
For this example, enter the following expression to define the custom weights by referencing the columns (Ndrug, Ntarget, and Ncomplex) from the data set directly: [1./Ndrug 1./Ntarget 1./Ncomplex]
Leave the rest of the program unchanged.
Hit Run from the Home tab. The app shows the Progress Plot while running the program. Once finished, you can close the plot.
The app generates several plots once the program finishes running. Click the Plot1 tab, which shows the fit plot for each group separately. To view them all together, in the Property Editor pane, under the Fit Plot section, change the option of Layout from trellis to one axes.
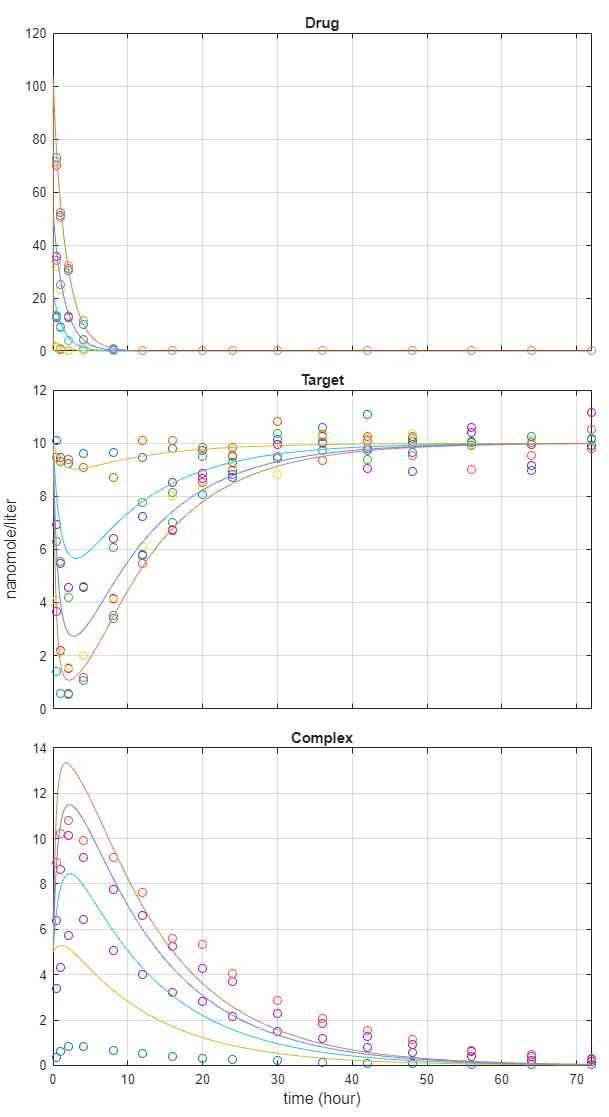
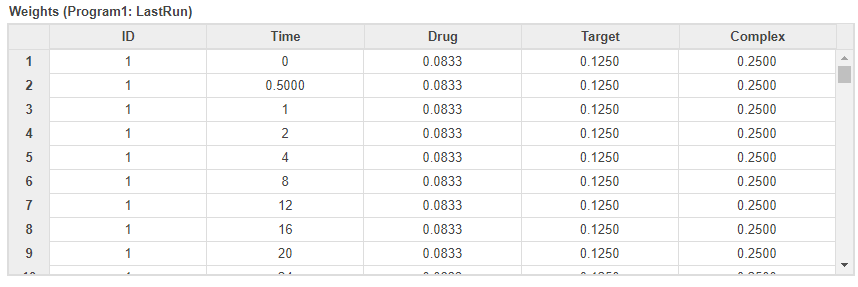
You can also check several fit quality statistics. Click the Datasheet2 tab. The datasheet shows several tables including pooled parameter estimates, fit quality statistics, and weights used by the program. The next figure shows the weights table, which shows the corresponding weights used for each response based on your earlier weight specifications.
See Also
SimBiology Model Builder | SimBiology Model Analyzer | fitproblem
Topics
- Calculate NCA Parameters and Fit Model to PK/PD Data Using SimBiology Model Analyzer
- Find Important Tumor Growth Parameters with Local Sensitivity Analysis Using SimBiology Model Analyzer
- Find Important Parameters for Receptor Occupancy with Global Sensitivity Analysis Using SimBiology Model Analyzer
- Explore Biological Variability with Virtual Patients Using SimBiology Model Analyzer
- Scan Dosing Regimens Using SimBiology Model Analyzer App
- Scan Tumor Growth Using Group-Specific Doses and Variant Parameters from Data Set
- Simulate Groups Using Doses and Variants from Data Set