802.11 MAC and Application Throughput Measurement
This example shows how to measure the MAC and application layer throughput in a multi-node 802.11a/n/ac/ax network using SimEvents®, Stateflow®, and WLAN Toolbox™. The system-level model presented in this example includes functionalities such as configuring the priority of the traffic at the application layer, capability to generate and decode waveforms of Non-HT, HT-MF, VHT, HE-SU and HE-EXT-SU formats, MPDU aggregation and enabling block acknowledgment of MPDUs. The application layer throughput calculated using this model is validated against published calibration results from the TGax Task Group [ 4 ] for Box 3 scenarios (Tests 1a, 1b, and 2a) specified in TGax evaluation methodology [ 3 ]. The obtained application layer throughput is within the range of minimum and maximum throughput specified in published calibration results [ 4 ].
Throughput in 802.11 Networks
The IEEE® 802.11™ working group is continually adding features to 802.11 specification [ 1 ] to improve the throughput and reliability in WLAN networks. Throughput is the amount of data transmitted over a period of time. Medium Access Control (MAC) layer throughput refers to the amount of data successfully transmitted by the MAC layer over a period of time. MAC protocol data unit (MPDU) is the unit of transmission at MAC layer. In 802.11n, MPDU aggregation was introduced to increase the throughput. When MPDU aggregation is supported, MAC layer aggregates multiple MPDUs into an aggregated MPDU (A-MPDU) for transmission. This reduces the overhead of channel contention for transmitting multiple frames, resulting in enhanced throughput. In 802.11ac [ 1 ] and 802.11ax [ 2 ], the maximum limits for an A-MPDU length were increased resulting in even better throughput in WLAN networks.
Model 802.11 Network
This example models a WLAN network with five nodes as shown in this figure. These nodes implement carrier-sense multiple access with collision avoidance (CSMA/CA) with physical carrier sense and virtual carrier sense. The physical carrier sensing uses the clear channel assessment (CCA) mechanism to determine whether the medium is busy before transmitting. Whereas, the virtual carrier sensing uses the RTS/CTS handshake to prevent the hidden node problem.
The model in the example displays various statistics such as the number of transmitted, received, and dropped packets at PHY and MAC layers. Moreover, the runtime figures that help in analyzing/estimating the node-level and network-level performance are also displayed in this model. This model is validated against the published calibration results from the TGax Task Group [ 4 ] for Box 3 scenarios (Tests 1a, 1b, and 2a) specified in TGax evaluation methodology [ 3 ].
WLAN Network

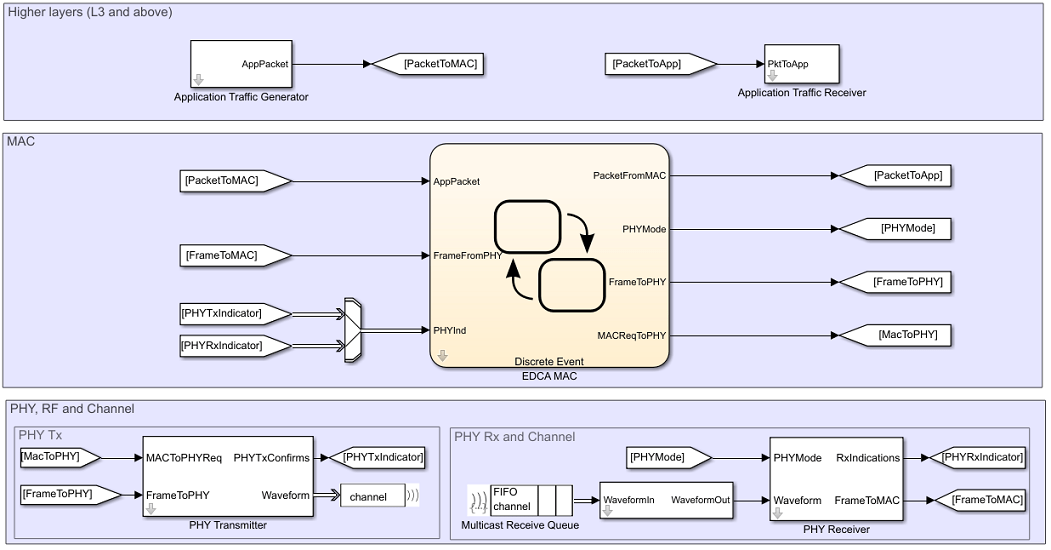
Components of a WLAN Node
The components of a WLAN node are shown in this figure. The information is retrieved by pressing the arrow button for each node in the above figure.
Application, EDCA MAC, PHY, and Channel Block Capabilities
Application:
The application layer has the capability to generate data with different priority levels as shown in this figure. These priority levels are configured using Access Category property in the mask parameters of the Application Traffic Generator block inside a WLAN node. You can also configure the packet size, inter-packet interval, and destination node for the application layer.

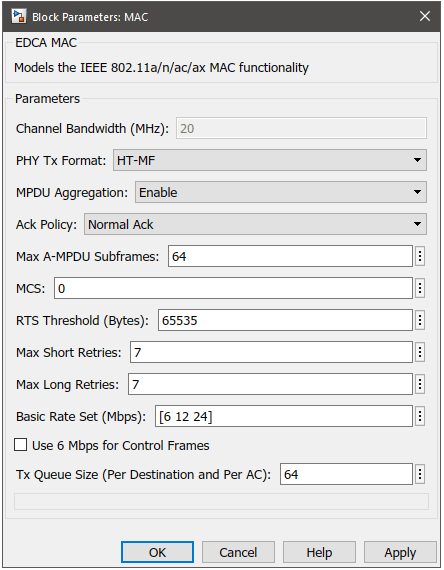
EDCA MAC:
The EDCA MAC block used in this example has the following capabilities:
Generate and decode MAC frames of high efficiency single user (HE-SU), high efficiency extended range single user (HE-EXT-SU), very high throughput (VHT), high throughput mixed format (HT-MF) and Non-HT formats. These formats are configured using the
PHY Tx Formatproperty in the mask parameters of the MAC EDCA block inside a WLAN node as shown in this figure.Aggregate MPDUs to form an A-MPDU. This can be configured by setting
PHY Tx Formatto one ofHT-MF,VHT,HE-SU, orHE-EXT-SU. In case ofHT-MF,MPDU Aggregationproperty must also be enabled for A-MPDU generation.Acknowledge multiple MPDUs in an A-MPDU with a single block acknowledgment (BA) frame. MAC assumes a pre-configured BA session between the transmitter and the receiver of an A-MPDU.
Enable/disable acknowledgments. This can be configured using the
Ack Policyproperty.Maintain separate retry limits for shorter frames (less than RTS threshold) and longer frames (greater than or equal to RTS threshold). These limits can be configured using the
Max Short RetriesandMax Long Retriesproperties.Transmit multiple streams of data using the multiple-input multiple-output (MIMO) capability. You can configure this capability using the
Number of Transmit Chainsproperty. This property is applicable only when the value ofPHY Tx Formatproperty is set toVHT,HE-SU, orHE-EXT-SU. The MIMO capability can also be used forHTformat through theMCSproperty. The range of values [0, 7], [8, 15], [16, 23], and [24, 31] correspond to one, two, three, and four streams of data respectively.Adapt the data rate according to the channel conditions through the
Rate Adaptation Algorithmproperty. This is applicable only when the value ofPHY Tx Formatproperty is set toNon-HT. You can choose betweenAuto Rate Fallback (ARF)andMinstrelalgorithms. To maintain a constant data rate throughout the simulation,Fixed-Rateoption is available.
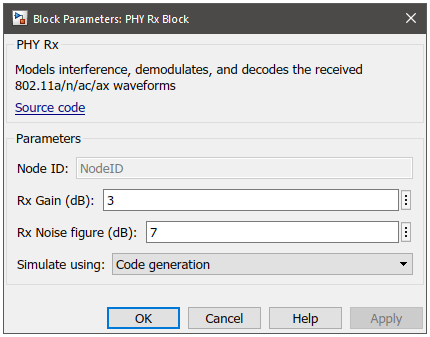
PHY:
The PHY Transmitter and PHY Receiver blocks have the capability to generate and decode waveforms of Non-HT, HT-MF, VHT, HE-SU and HE-EXT-SU formats. You can configure the transmit gain and transmit power using the Tx Gain and Tx Power properties in the mask parameters of the PHY Transmitter block inside a WLAN node.

Similarly, you can configure the receive gain and receive noise figure using the Rx Gain and Rx Noise Figure properties in the mask parameters of the PHY Receiver block inside a WLAN node.
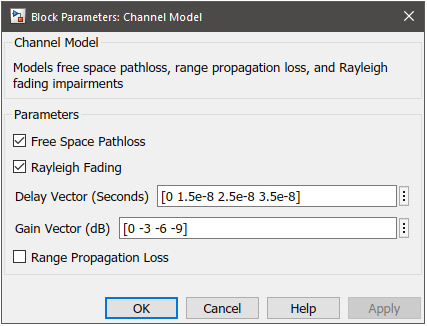
Channel:
Channel impairments determined by free-space path-loss model and Rayleigh multipath fading are added to the transmitted PHY waveform. You can choose to enable or disable these impairment models. In addition to the impairment models, the signal reception range can also be limited by an optional range propagation loss model. To model any of these losses, the channel model must contain both the sender and receiver positions along with the transmitted signal strength. The channel is modeled inside each receiving node, before passing the waveform to the PHY Receiver block.
Throughput Measurement
Throughput varies for different configuration parameters pertaining to the application, MAC & PHY layers. Any change in the configuration may either increase or decrease the throughput. You can vary the combination of these parameters to measure and analyze the throughput.
MCS: PHY data ratePHY Tx Format: PHY transmission formatPacket Size: Application packet sizeMax A-MPDU Subframes: Maximum number of subframes in an A-MPDUMax Tx Queue Size: MAC transmission queue size
Along with above parameters, you can also vary the node positions, Tx & Rx gains, channel loss, number of nodes in the network, MAC contention parameters, number of transmit chains and rate adaptation algorithms to analyze MAC throughput. This example demonstrates the measurement and analysis of the MAC throughput by varying packet size in the Application Traffic Generator block.
Application Packet Size
Throughput is directly proportional to the application packet size. Smaller packet size results in greater number of packets to be transmitted. At the MAC layer, there is an overhead of contention time for each transmitted packet. This is because the MAC layer makes sure that the channel is idle for a specific amount of time (Refer section 10.3.2.3 of [ 1 ]) before transmitting any packet. Therefore, as the packet size decreases, the contention overhead increases resulting in lower throughput.
Model Configuration
You can configure the application packet size using these steps:
Open model
WLANMACThroughputMeasurementModel.slxTo go inside a node subsystem, click on the downward arrow at the bottom left of the node
To open mask parameters of the application, double click on
Application Traffic GeneratorTo enable application, set
App Stateto 'On'Configure the value of
Packet Size
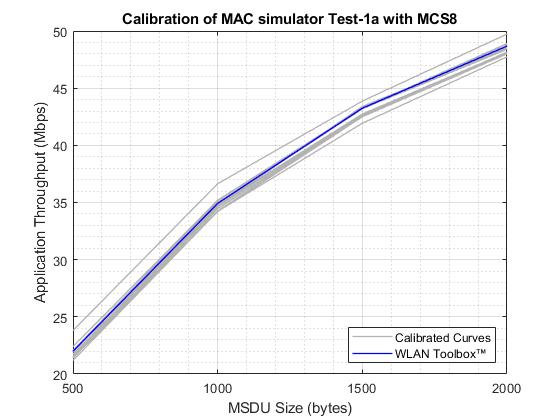
Run the simulation and observe the throughput. The TGax calibration results for test-1a in [ 4 ] are shown below:
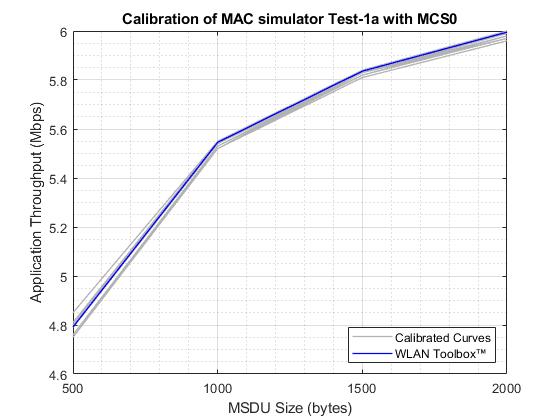
The above plot compares the calibration results for WLAN Toolbox against the published results of other companies listed in [ 4 ]. The blue colored curve represents the results of WLAN Toolbox, while the grey colored curves represent the results of other companies.
Simulation Results
The simulation of the model generates:
A run-time visualization showing the time spent on channel contention, transmission, and reception for each node
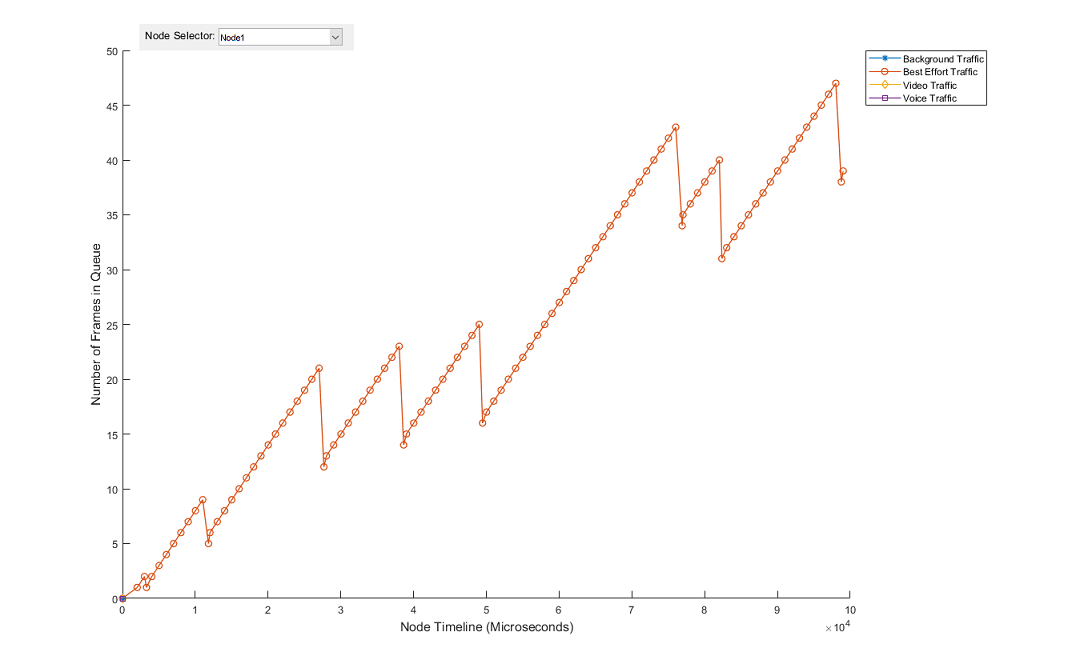
An optional run-time visualization (during the simulation) showing the number of frames queued in MAC transmission queues for a selected node.
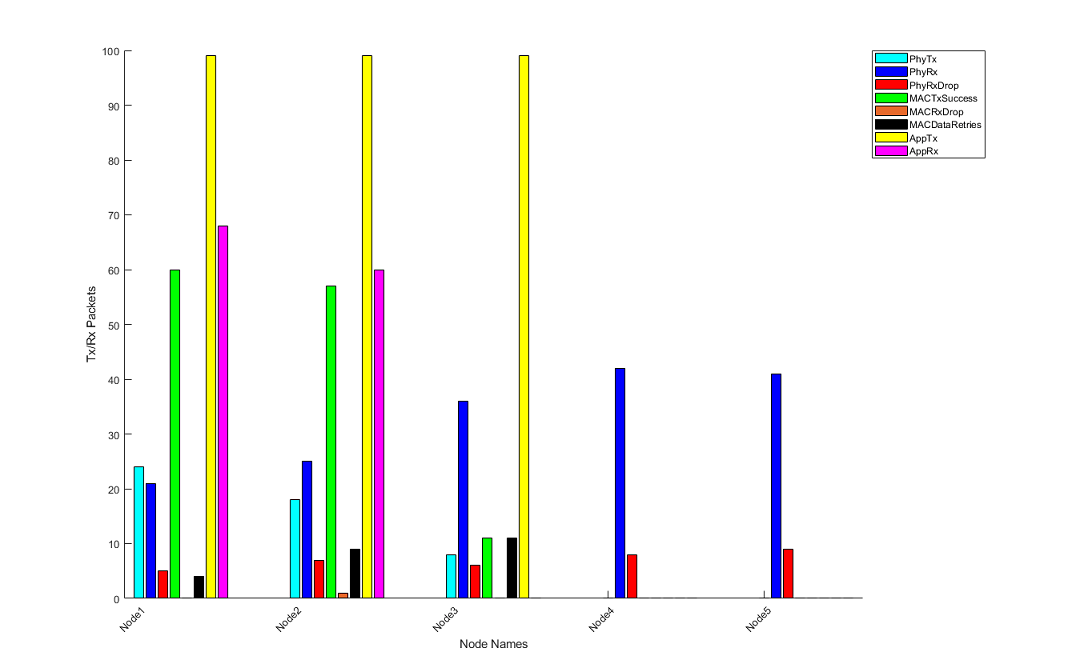
A bar graph showing metrics for each node such as number of transmitted, received, and dropped packets at PHY and MAC layers
A MAT file
statistics.matwith detailed statistics obtained at each layer for each node
This figure shows MAC state transitions with respect to simulation time.
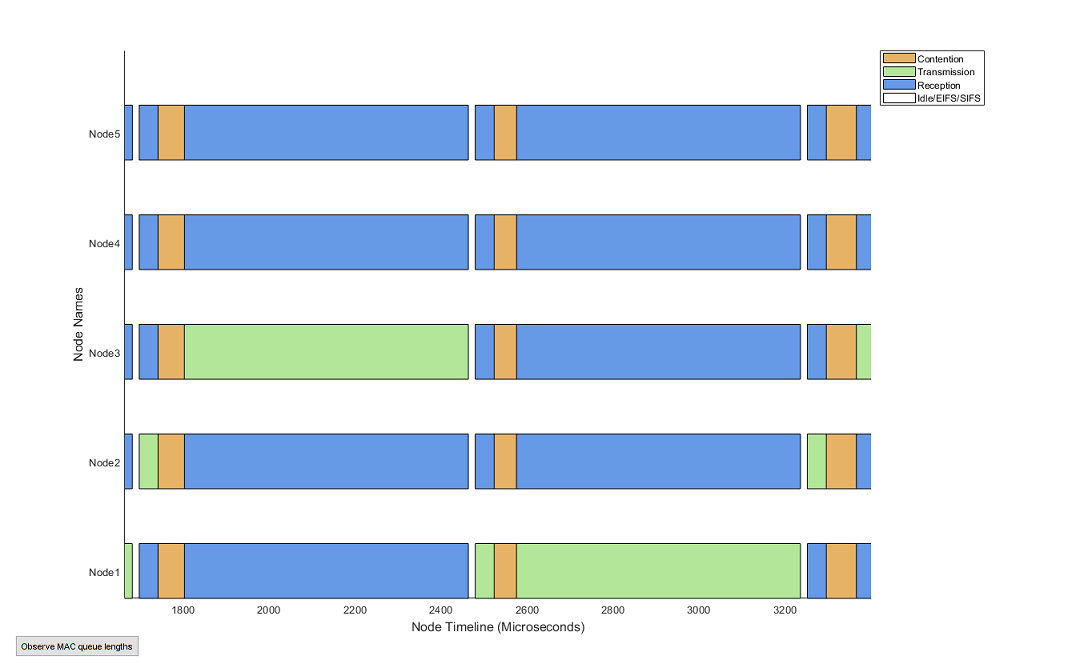
You can also observe the live state of the MAC layer transmission buffers using the 'Observe MAC queue lengths' button in the above visualization.
This figure shows the network statistics at the end of simulation.
Validating Application Layer Throughput with TGax Calibration Results
The TGax Task Group [ 4 ] published application throughput results for different scenarios. You can observe the Layer 3 (above MAC layer) throughput of each node in the network in 'Throughput' column in 'statisticsTable' stored in 'statistics.mat'. The TGax calibration scenarios for MAC simulator published results of application throughput for a User Datagram Protocol (UDP) with Logical Link Control (LLC) layers overhead.
To calculate application throughput from simulation results use the code below:
% Load statistics.mat (Output of the simulation) file
simulationResults = load('statistics', 'statisticsTable');
% Statistics
stats = simulationResults.statisticsTable;

% Successfully transmitted MAC layer bytes in the network
totalMACTxBytes = sum(stats.MACTxBytes);

% UDP & LLC overheads (bytes)
udpOverhead = 36;
llcOverhead = 8;

% UDP & LLC overhead (bytes) in the network
udpAndLLCOverhead = sum(stats.MACTxSuccess)*(udpOverhead + llcOverhead);

% Successfully transmitted application bytes
totalAppTxBytes = totalMACTxBytes - udpAndLLCOverhead;

% Time at which last transmission is completed in the network (Microseconds)
simulationTime = max(stats.MACRecentFrameStatusTimestamp);

% Application throughput (Mbps)
applicationThroughput = (totalAppTxBytes*8)/simulationTime;
disp(['Application Throughput = ' num2str(applicationThroughput) ' Mbps']);
Application Throughput = 4.7276 Mbps
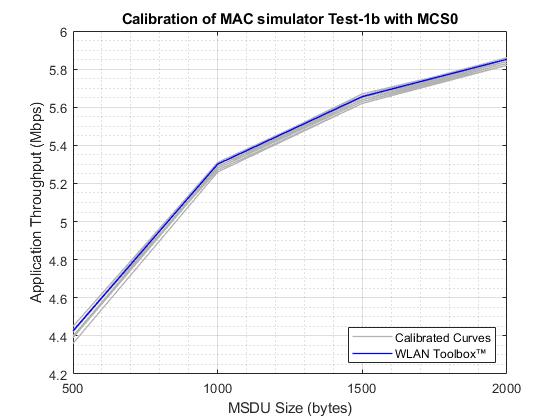
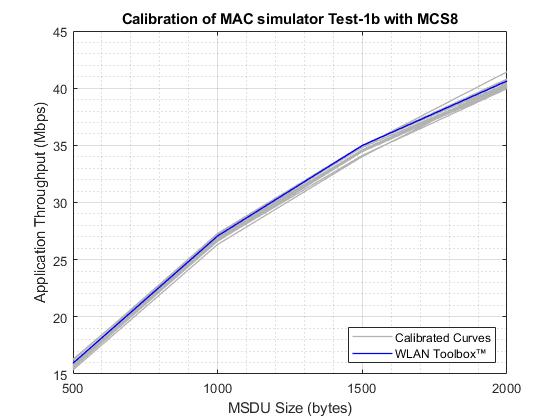
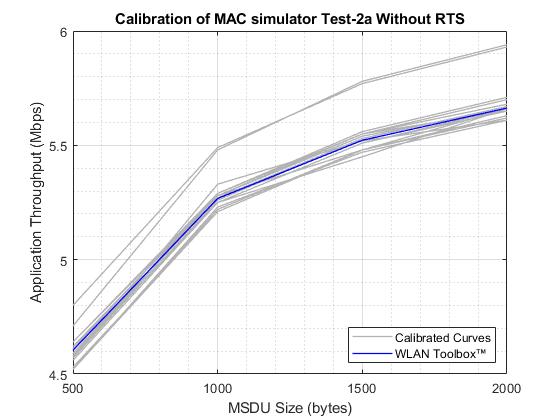
The application throughput for different TGax calibration scenarios is plotted against different MAC service data unit (MSDU) sizes for a simulation time of 30 seconds as shown below:

Further Exploration
Configuration options
You can change these configuration parameters to further explore this example:
Application layer: Access category and packet interval
MAC layer: RTS threshold, Tx queue size, data rate, short retry limit, long retry limit, transmitting frame format, MPDU aggregation, ack policy, number of transmit chains and the rate adaptation algorithms
PHY: PHY Tx gain, PHY Rx gain, and Rx noise figure
Channel modeling: Rayleigh fading, free space pathloss, range propagation loss and packet receive range
Node positions using node position allocator
The state of each node can be visualized during the run-time through the configuration available in the Visualizer block
By default, the PHY transmitter and the receiver blocks run in the
Interpreted executionmode. For longer simulation time, configure all the blocks toCode generationmode for better performance.
Related examples
Refer these examples for further exploration:
To model a multi-node IEEE 802.11ax network with abstracted PHY using SimEvents, refer 802.11ax System-Level Simulation with Physical Layer Abstraction (WLAN Toolbox) example.
To get started on modeling a multi-node IEEE 802.11 network using MATLAB, refer Get Started with WLAN System-Level Simulation in MATLAB (WLAN Toolbox)
To model a multi-node IEEE 802.11ax residential scenario using MATLAB, refer 802.11ax Multinode System-Level Simulation of Residential Scenario (WLAN Toolbox)
This example enables you to create and configure a multi-node 802.11 network using a Simulink model for analyzing the MAC and application layer throughput. In this model, the MAC throughput obtained through the simulation results is used to calculate the application layer throughput. This model is validated using the Box 3 scenarios (Tests 1a, 1b, and 2a) specified in TGax evaluation methodology [ 3 ] to confirm that it complies with the IEEE 802.11 [ 1 ]. This example concludes that the calculated application layer throughput is within the range of minimum and maximum throughput specified in published calibration results [ 4 ].
References
IEEE Std 802.11™-2020. IEEE Standard for Information Technology - Telecommunications and Information Exchange between Systems - Local and Metropolitan Area Networks - Specific Requirements - Part 11: Wireless LAN Medium Access Control (MAC) and Physical Layer (PHY) Specifications.
IEEE Std 802.11ax™-2021. IEEE Standard for Information Technology - Telecommunications and Information Exchange between Systems - Local and Metropolitan Area Networks - Specific Requirements - Part 11: Wireless LAN Medium Access Control (MAC) and Physical Layer (PHY) Specifications - Amendment 1: Enhancements for High-Efficiency WLAN.
IEEE 802.11-14/0571r12. "11ax Evaluation Methodology." IEEE P802.11P: Wireless LANs.
Baron, Stephane., Nezou, Patrice., Guignard, Romain., and Viger, Pascal. "MAC Calibration Results." Presentation at the IEEE P802.11 - Task Group AX, September 2015.
You can also select a web site from the following list:
Americas
- América Latina (Español)
- Canada (English)
- United States (English)
Europe
- Belgium (English)
- Denmark (English)
- Deutschland (Deutsch)
- España (Español)
- Finland (English)
- France (Français)
- Ireland (English)
- Italia (Italiano)
- Luxembourg (English)
- Netherlands (English)
- Norway (English)
- Österreich (Deutsch)
- Portugal (English)
- Sweden (English)
- Switzerland
- United Kingdom (English)