表征电动汽车的电池电芯
R2026a此示例说明了如何使用 [1] 中的测试方法对电动汽车应用的电池电芯进行特性分析。此例估计了在五种不同环境温度下,BAK N18650CL-29 18650 型锂离子电芯 [2] 的参数。电池混合脉冲功率特性 (HPPC) 测试在受控的环境箱中进行。
电池测试
典型的 HPPC 数据是一组放电-充电脉冲,在不同的荷电状态 (SOC) 和给定温度 [1] 下施加到电池上。脉冲的幅度取决于电芯容量和测试温度。在每次放电-充电脉冲操作序列结束时,通过施加恒定放电电流 C/3,SOC 约下降 10%。建议在每次放电-充电脉冲序列后,让电芯休息一个小时,以使其放松。该过程持续进行,直至覆盖 SOC 范围内的所有关键点。如需更多信息,请参阅 [1]。
绘制电池测试数据图
生物学 BCS-815 8 通道电池测试仪,配备标准电缆、配件和热电偶,进行了电池 HPPC 测试 [3]。测试舱保持了温度和湿度控制。为了测量温度,测试人员使用了配备多路复用器功能的安捷伦 34972A 数据采集系统(搭配 34901A 20 通道多路复用器)。该系统测试了三种不同的采样。测试每次均可重现。电芯在五种不同的温度下进行了测试: 和 箱温。在测试期间,温度保持均匀。有关测试流程的更多信息,请参阅[1]。
这些图显示了电池测试数据。每组测试数据包含九对放电-充电脉冲。每次放电-充电操作后,C/3 恒定电流(SOC 扫描步骤)将电芯 SOC 降低 10%。要读取、可视化并从 HPPC 测试数据中提取单个脉冲信息,请使用 hppcTest 函数。
TestTemperatures = [0 10 25 35 45];
testData = struct();

for tempIdx = 1:5
    filename = strcat("hppcDataBAKcell",mat2str(TestTemperatures(tempIdx)),"degC");
    loadFileName = fullfile("testDataBAKcells",filename);
    load(loadFileName)
    testData.(filename) = hppcTest(hppcData,TimeVariable="time (s)",...
        VoltageVariable="voltage (V)",CurrentVariable="current (A)",...
        ValidVoltageRange=[2.8 4.6]);
    figure
    plot(testData.(filename))
    title(filename)
end
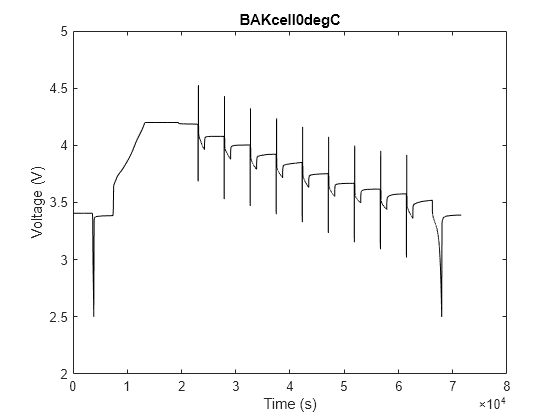
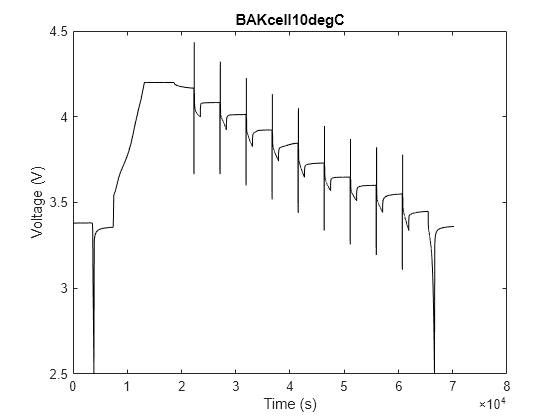
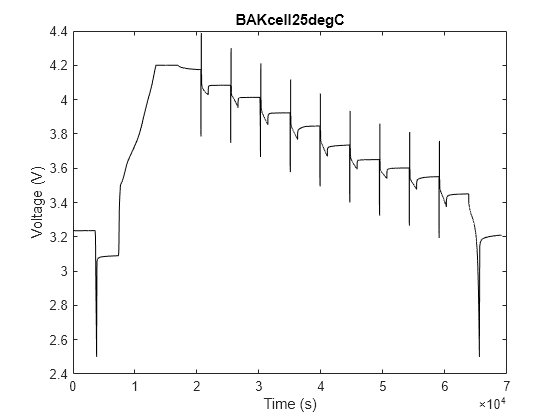
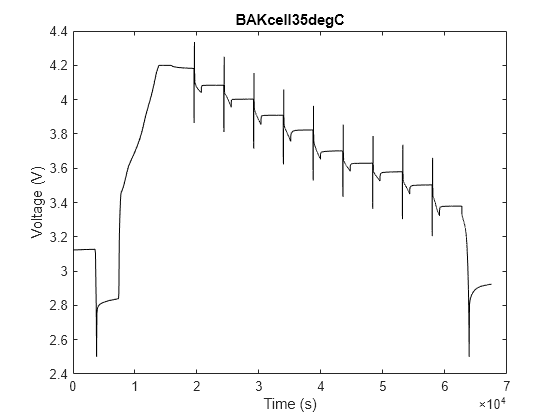
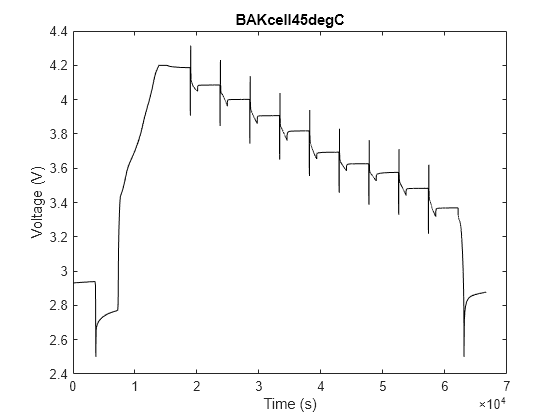
hppcTest 函数会自动读取 HPPC 测试数据,并识别出所有单独的负载脉冲。该函数返回一个 HPPCTest 对象,该对象能够自动对电池等效电路模型进行参数估计。为了进一步优化您希望进行滤波、制表并纳入参数估计过程的脉冲,请定义以下属性:
CurrentOnThreshold- 用于判断当前处于充电还是放电状态的阈值电流值,指定为双精度标量。VoltageChangeThreshold- 指示正在发生充电还是放电的阈值电压变化值,指定为双精度标量。ValidPulseDurationRange- 有效的脉冲持续时间范围,用于判断一个脉冲是否有效且应存储在TestSummary属性表中,指定为一个1-by-2 的双精度向量。ValidVoltageRange- 有效的电池电压范围,用于判断脉冲是否有效以及是否应将其存储在TestSummary属性表中,指定为一个1-by-2的双精度向量。
要查看最终识别出的脉冲的表格摘要,请访问您之前创建的任意一个 HPPCTest 对象的 TestSummary 属性。
disp(testData.hppcDataBAKcell25degC.TestSummary)
    PulseID    Directionality      SOC          HPPCData         PulseDuration    PseudoOCV_V    MaximumVoltage    MinimumVoltage    Current_A    C_rate    PulseStartIndex    PulseEndIndex    Temperature_degC
    _______    ______________    _______    _________________    _____________    ___________    ______________    ______________    _________    ______    _______________    _____________    ________________

       1        "Discharge"            1    {701×6 timetable}         30            4.1745           4.1745            3.7846         -6.1869     1.8976           354              1055               25
       2        "Discharge"      0.90376    {701×6 timetable}         30            4.0837           4.0837            3.7479          -6.187     1.8977          2702              3403               25
       3        "Discharge"      0.80754    {702×6 timetable}         30            4.0132           4.0132            3.6652         -6.1867     1.8975          5049              5751               25
       4        "Discharge"      0.71133    {701×6 timetable}         30            3.9226           3.9226            3.5775         -6.1868     1.8976          7398              8099               25
       5        "Discharge"      0.61512    {701×6 timetable}         30             3.846            3.846            3.4942         -6.1868     1.8976          9746             10447               25
       6        "Discharge"      0.51891    {701×6 timetable}         30            3.7353           3.7353            3.4001         -6.1871     1.8977         12094             12795               25
       7        "Discharge"       0.4227    {701×6 timetable}         30              3.65             3.65            3.3236         -6.1867     1.8975         14442             15143               25
       8        "Discharge"      0.32649    {701×6 timetable}         30            3.6015           3.6015            3.2652         -6.1869     1.8976         16790             17491               25
       9        "Discharge"      0.23028    {701×6 timetable}         30            3.5507           3.5507            3.1931         -6.1869     1.8976         19138             19839               25
      10        "Charge"         0.98415    {502×6 timetable}         10            4.1158           4.3889            4.1158          4.6393      1.423          1055              1557               25
      11        "Charge"         0.88793    {502×6 timetable}         10             4.057           4.3001             4.057          4.6406     1.4233          3403              3905               25
      12        "Charge"         0.79172    {502×6 timetable}         10            3.9674           4.2113            3.9674          4.6394      1.423          5751              6253               25
      13        "Charge"         0.69551    {502×6 timetable}         10            3.8751           4.1175            3.8751          4.6396      1.423          8099              8601               25
      14        "Charge"          0.5993    {502×6 timetable}         10            3.7905           4.0355            3.7905          4.6396      1.423         10447             10949               25
      15        "Charge"         0.50309    {502×6 timetable}         10            3.6936           3.9339            3.6936          4.6405     1.4233         12795             13297               25
      16        "Charge"         0.40688    {502×6 timetable}         10            3.6224           3.8602            3.6224          4.6396      1.423         15143             15645               25
      17        "Charge"         0.31066    {502×6 timetable}         10            3.5695           3.8109            3.5695          4.6397     1.4231         17491             17993               25
      18        "Charge"         0.21445    {502×6 timetable}         10            3.5098           3.7597            3.5098          4.6397     1.4231         19839             20341               25
估计电池参数
Simscape Battery 中的 Battery Equivalent Circuit 模块采用了等效电路模型。通过将多个电阻器-电容器 (RC) 对串联连接,可以捕捉电芯的不同物理现象。在 Battery Equivalent Circuit 模块中,最多可选择三对 RC 组合。您可以从 HPPC 测试数据中得出电阻和时间常数参数的值。
该方程式定义了电池电芯的电压响应:
其中:
是电芯开路电势。
是电芯的欧姆电阻。
和 是电芯第 i 个 RC 对电阻和时间常数值。
是通过电芯的电流。
t 表示历时。
该方程中的所有参数均可作为 SOC、电流负载、电流方向和电池温度的函数。某些 HPPC 测试标准在施加电流负载时,会确保电池的电量状态 (SOC) 和温度状态不会发生显著变化。因此,您可以假设温度是恒定的。该图显示了测试标准 [1] 中使用的典型充放电曲线。
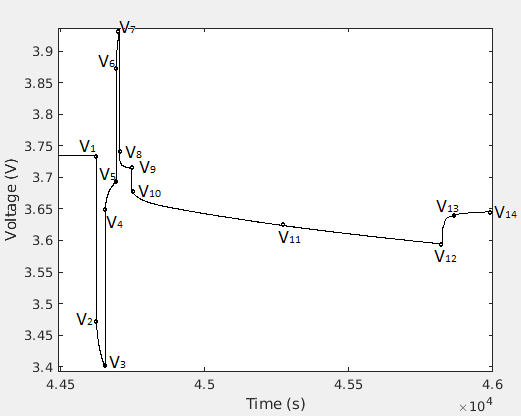
您可以通过放电或充电脉冲开始时电压的突然变化(例如 V1 到 V2 或 V5 到 V6)来估计电阻 。要估计 和 参数,您可以在放电 (V4 - V5) 或充电 (V8 - V9) 脉冲后立即使用短电压放松。您可以从 SOC 扫描步骤 (V9 - V12) 之后的更长电压放松阶段 (V12 - V14) 中提取更多的时常数。在此示例中,您使用 fitecm 函数来估计电池的 、 和 参数。
选择参数估计方法
参数估计过程涉及最小化 ECM 预测电压输出与 HPPC 测试中测得的电池电压响应之间的误差。本表展示了用于表示电池阻抗的最典型电化学模型。
为了将误差降至最低,需对模型参数(如 R0、R1 和 C1)进行迭代调整,直到测量电压与仿真电压之间的误差达到满意水平。MATLAB® 中有几种技术,可在 Model-Based Calibration Toolbox™、System Identification Toolbox™ 和 Curve Fitting Toolbox™ 中实现此功能。在此示例中,您通过使用 Simscape™ Battery™ 中实现的基于优化的拟合方法来估计电池模型的参数。该拟合方法采用对 fminsearch 函数的自定义实现。
针对特定工作点的电池 ECM 参数可能存在差异,这取决于参数估计过程中所采用的电流脉冲段或区段。负载分段参数适用于大多数应用场景。然而,最佳估计区间取决于电池 ECM 的具体终端应用场景。某些方法更适合用于估计特定区段的参数。例如,System Identification Toolbox tfest 函数最适合拟合纯载荷动力学模型。本表根据所选工具箱或方法,汇总了 fitecm 函数中 FittingMethod 和 SegmentToFit 参量支持的选项。Curve Fitting Toolbox 包含一些用于估计松弛段参数的良好方法。
根据短暂松弛估算时间常数
testData 结构体包含脉冲段和短暂电压松弛段的相关信息。对于短时电压松弛段和负载段,可能没有足够的信息来拟合远大于 10 秒的 RC 支路的时间常数。在这些情况下,要进行参数估计,请选择一个 1-RC 等效电路。要根据脉冲后的短暂松弛段估算时间常数,请使用 fitecm 函数,并将 SegmentToFit 参量设为 "relaxation",ECM 参量设为 1RC ECM。
batteryEcm25degC = fitECM(testData.hppcDataBAKcell25degC,ECM=ecm(1),SegmentToFit="relaxation"); 要直观地验证前四个脉冲的拟合情况,请使用 plot 方法。松弛段的时间常数并不一定能很好地拟合脉冲的负载段。其他因素(例如假设开路电压为一个标量常数)可能会影响这些图中拟合结果的准确性。通过这些图表需要验证的关键结果是,仿真和实测电压点之间的松弛行为是否一致。
plot(batteryEcm25degC,1:4)
要查看时间常数值,请访问 batteryEcm25degC 对象的 ParameterSummary 属性。
disp(batteryEcm25degC.ParameterSummary)
    ID    Directionality      SOC      Temperature_degC    Current_A    OpenCircuitVoltage       R0          R1         Tau1       C1        FitPc
    __    ______________    _______    ________________    _________    __________________    ________    _________    ______    ______    __________

     1     "Discharge"            1           25            -6.1869           4.1745          0.043854    0.0098299    10.217    1039.4     0.0026152
     2     "Discharge"      0.90376           25             -6.187           4.0837          0.040707    0.0094222    10.262    1089.2     0.0021524
     3     "Discharge"      0.80754           25            -6.1867           4.0132          0.039485    0.0097654    11.243    1151.3     0.0019493
     4     "Discharge"      0.71133           25            -6.1868           3.9226          0.039243    0.0094014    11.678    1242.1     0.0017278
     5     "Discharge"      0.61512           25            -6.1868            3.846           0.03937    0.0090181    11.633    1289.9     0.0016414
     6     "Discharge"      0.51891           25            -6.1871           3.7353          0.039686    0.0081095    11.185    1379.2     0.0014102
     7     "Discharge"       0.4227           25            -6.1867             3.65          0.040354    0.0083378    11.252    1349.6     0.0013838
     8     "Discharge"      0.32649           25            -6.1869           3.6015           0.04115    0.0085245    11.562    1356.4     0.0013272
     9     "Discharge"      0.23028           25            -6.1869           3.5507          0.042858    0.0086828    11.024    1269.6       0.00164
    10     "Charge"         0.98415           25             4.6393           4.1158            0.0482    0.0052075    3.8168    732.95    0.00053578
    11     "Charge"         0.88793           25             4.6406            4.057          0.043691    0.0043709    4.3715    1000.1     0.0003732
    12     "Charge"         0.79172           25             4.6394           3.9674          0.042342    0.0045548    4.3033    944.79    0.00035176
    13     "Charge"         0.69551           25             4.6396           3.8751           0.04209     0.004625    4.1394       895    0.00032855
    14     "Charge"          0.5993           25             4.6396           3.7905          0.042434    0.0047765    3.8075    797.13    0.00034043
    15     "Charge"         0.50309           25             4.6405           3.6936          0.043065     0.004334    4.1386    954.92    0.00049142
    16     "Charge"         0.40688           25             4.6396           3.6224          0.043463    0.0039566     4.798    1212.7    0.00033171
    17     "Charge"         0.31066           25             4.6397           3.5695          0.044009    0.0038565    4.7506    1231.8    0.00029811
    18     "Charge"         0.21445           25             4.6397           3.5098          0.045168    0.0040985    4.8543    1184.4    0.00032097
根据长时松弛估算时间常数
要从较长的电压松弛脉冲中提取时间常数,必须首先通过定义 ValidPulseDurationRange 和 ValidVoltageRange 名称-值参量,使用 hppcTest 函数对 HPPC 数据进行滤波。如果提高脉冲持续时间的最小和最大阈值,也会过滤掉持续时间较短的脉冲,从而仅获得具有较长电压放松段的 SOC 扫描脉冲。
for tempIdx = 1:5
    filename = strcat("hppcDataBAKcell",mat2str(TestTemperatures(tempIdx)),"degC");
    loadFileName = fullfile("testDataBAKcells",filename);
    load(loadFileName)

    testData.(strcat(filename,"Long")) = hppcTest(hppcData,TimeVariable="time (s)",...
        VoltageVariable="voltage (V)",CurrentVariable="current (A)", ...
    ValidPulseDurationRange=[100 1600],ValidVoltageRange=[3 4.6]);
end
要检查 HppcTest 对象中的各个脉冲,请使用 plot 方法。
figure
plot(testData.hppcDataBAKcell25degCLong)
title("Long relaxation pulses 25degC")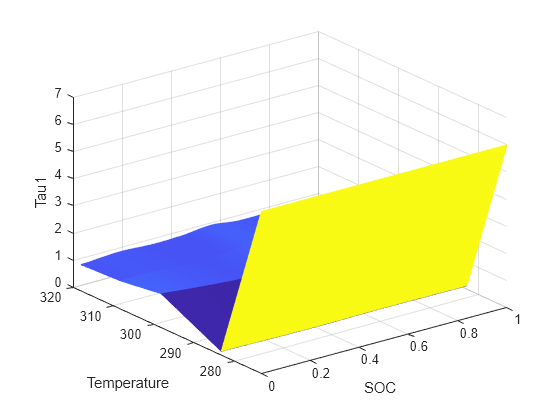
disp(testData.hppcDataBAKcell25degCLong.TestSummary)
    PulseID    Directionality      SOC           HPPCData         PulseDuration    PseudoOCV_V    MaximumVoltage    MinimumVoltage    Current_A    C_rate     PulseStartIndex    PulseEndIndex    Temperature_degC
    _______    ______________    _______    __________________    _____________    ___________    ______________    ______________    _________    _______    _______________    _____________    ________________

       1        "Discharge"      0.98811    {1145×6 timetable}        1081           4.1416           4.1416            4.0285        -0.91589     0.28092          1557              2702               25
       2        "Discharge"      0.89189    {1144×6 timetable}        1081           4.0781           4.0781            3.9534        -0.91593     0.28093          3905              5049               25
       3        "Discharge"      0.79568    {1145×6 timetable}        1081           3.9949           3.9949            3.8544        -0.91594     0.28093          6253              7398               25
       4        "Discharge"      0.69947    {1145×6 timetable}        1081           3.9021           3.9021            3.7672        -0.91597     0.28094          8601              9746               25
       5        "Discharge"      0.60326    {1145×6 timetable}        1081           3.8171           3.8171            3.6693        -0.91604     0.28096         10949             12094               25
       6        "Discharge"      0.50705    {1145×6 timetable}        1081           3.7145           3.7145            3.5944        -0.91599     0.28095         13297             14442               25
       7        "Discharge"      0.41084    {1145×6 timetable}        1081           3.6413           3.6413            3.5392        -0.91597     0.28094         15645             16790               25
       8        "Discharge"      0.31462    {1145×6 timetable}        1081             3.59             3.59             3.476        -0.91584      0.2809         17993             19138               25
       9        "Discharge"      0.21841    {1148×6 timetable}        1082           3.5324           3.5324            3.3742        -0.91575     0.28087         20341             21489               25
要根据 SOC 扫频脉冲后的长松弛段来估算时间常数,请使用 fitecm 函数。
batteryEcm25degCLong = fitECM(testData.hppcDataBAKcell25degCLong, SegmentToFit = "relaxation"); 要查看时间常数值,请使用 batteryEcm25degCLong 对象的 ParameterSummary 属性。这些时间常数可能无法很好地拟合脉冲的负载段。
disp(batteryEcm25degCLong.ParameterSummary)
    ID    Directionality      SOC      Temperature_degC    Current_A    OpenCircuitVoltage       R0           R1           Tau1           C1           R2         Tau2       C2        FitPc
    __    ______________    _______    ________________    _________    __________________    ________    __________    __________    __________    _________    ______    ______    __________

    1      "Discharge"      0.98811           25           -0.91589           4.1416          0.037254      0.016552        3.3039         199.6    0.0061691    254.79     41301    3.7102e-06
    2      "Discharge"      0.89189           25           -0.91593           4.0781          0.035967      0.019408    1.0001e-10    5.1529e-09    0.0088514     42.43    4793.6    5.0498e-05
    3      "Discharge"      0.79568           25           -0.91594           3.9949          0.035675      0.027497        40.294        1465.4     0.011182    338.03     30229    2.6218e-06
    4      "Discharge"      0.69947           25           -0.91597           3.9021          0.035987    1.6543e-05    1.1726e-10    7.0885e-06     0.045121    37.133    822.97     0.0019725
    5      "Discharge"      0.60326           25           -0.91604           3.8171          0.036338         1e-05    0.00017667        17.667     0.030543    27.427    897.97    0.00082185
    6      "Discharge"      0.50705           25           -0.91599           3.7145          0.037034         1e-05    4.4858e-07      0.044858      0.02241    34.556      1542    7.1771e-05
    7      "Discharge"      0.41084           25           -0.91597           3.6413          0.037719      0.019914    1.0003e-10    5.0229e-09    0.0082379    35.722    4336.4    0.00033233
    8      "Discharge"      0.31462           25           -0.91584             3.59          0.038465      0.018573        1.4823        79.809     0.030163    719.11     23841    2.0817e-05
    9      "Discharge"      0.21841           25           -0.91575           3.5324          0.040896      0.024498          49.1        2004.3     0.021757    721.75     33173    7.0132e-06
参数化 Battery Equivalent Circuit 模块
要对 Battery Equivalent Circuit 模块进行参数化,并可视化您在 TestTemperatures 工作区变量中指定的所有温度下的验证结果,请在 MATLAB 命令行窗口中输入:
hppcSuite = hppcTestSuite([testData.hppcDataBAKcell0degC,...
    testData.hppcDataBAKcell10degC,...
    testData.hppcDataBAKcell25degC,...
    testData.hppcDataBAKcell35degC,...
    testData.hppcDataBAKcell45degC], ...
    Temperature=TestTemperatures);

batteryEcm = fitECM(hppcSuite,SegmentToFit="loadAndRelaxation");
您还可以通过选择脉冲的 "relaxation" 或 "load" 段,对等效电路模型进行参数化。此外,您也可以选择改用长电压松弛脉冲来拟合模型。
要对 Battery Equivalent Circuit 模块进行参数化,请打开 CellDischargeCC 模型并获取 Battery Equivalent Circuit 模块的句柄。
modelName = "CellDischargeCC";
open_system(modelName);
blockHandle = getSimulinkBlockHandle( strcat(modelName,"/battery"));
使用 parameterizeEquivalentCircuitBlock 函数,然后关闭模型。
batteryEcm.ResistanceTemperatureBreakpoints = simscape.Value([10,25,35,45] + 273.15,"K");
parameterizeEquivalentCircuitBlock(batteryEcm,blockHandle,"ParameterizePseudoOCV",false)
close_system(modelName,1)
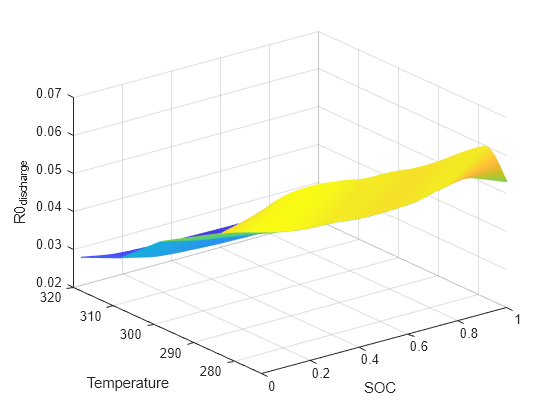
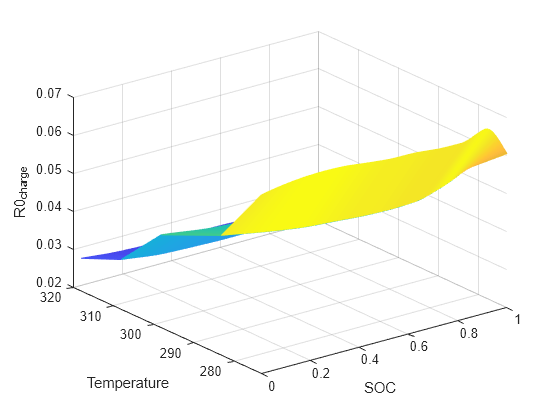
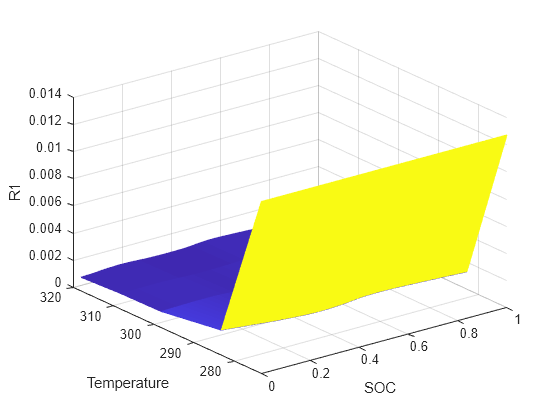
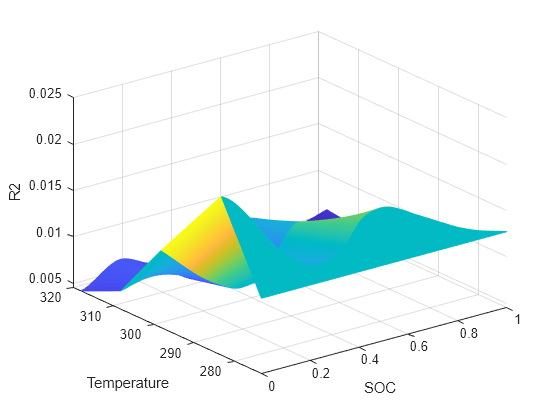
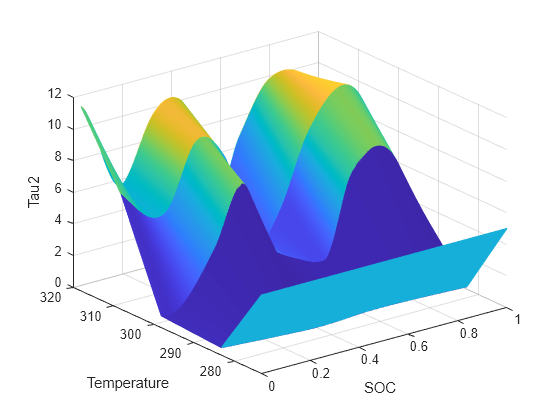
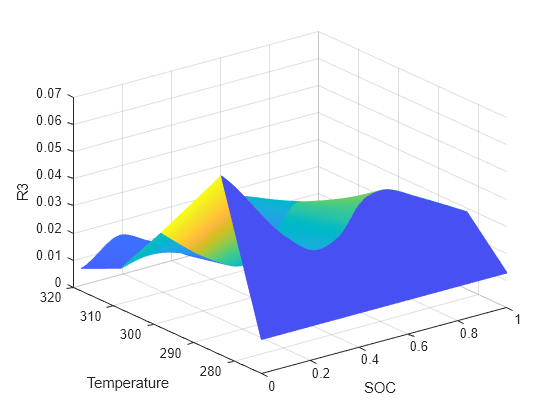
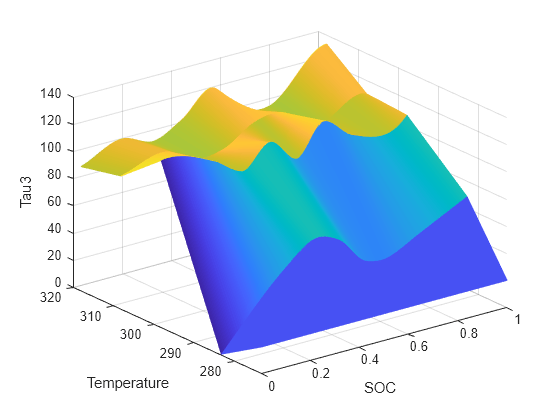
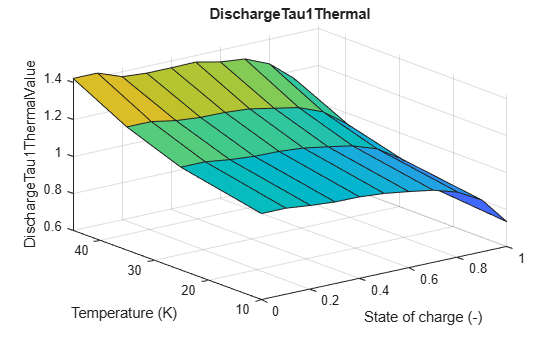
要可视化参数趋势,请使用 batteryEcm 对象的 plotModelParameters 方法。
plotModelParameters(batteryEcm)





使用估计参数仿真电池
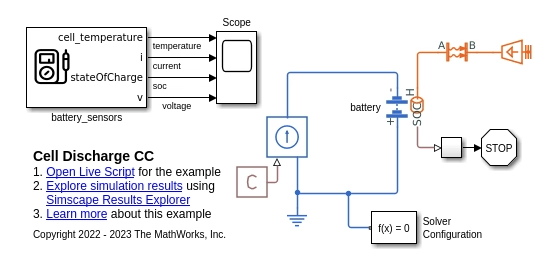
下图显示了 CellDischargeCC 模型。

设置仿真的最小和最大 C 率。
oneHr = 3600;
C_rate_min = 0.25;
C_rate_max = 1;
C_rate_del = 0.25;
numCases = (C_rate_max - C_rate_min)/C_rate_del + 1;
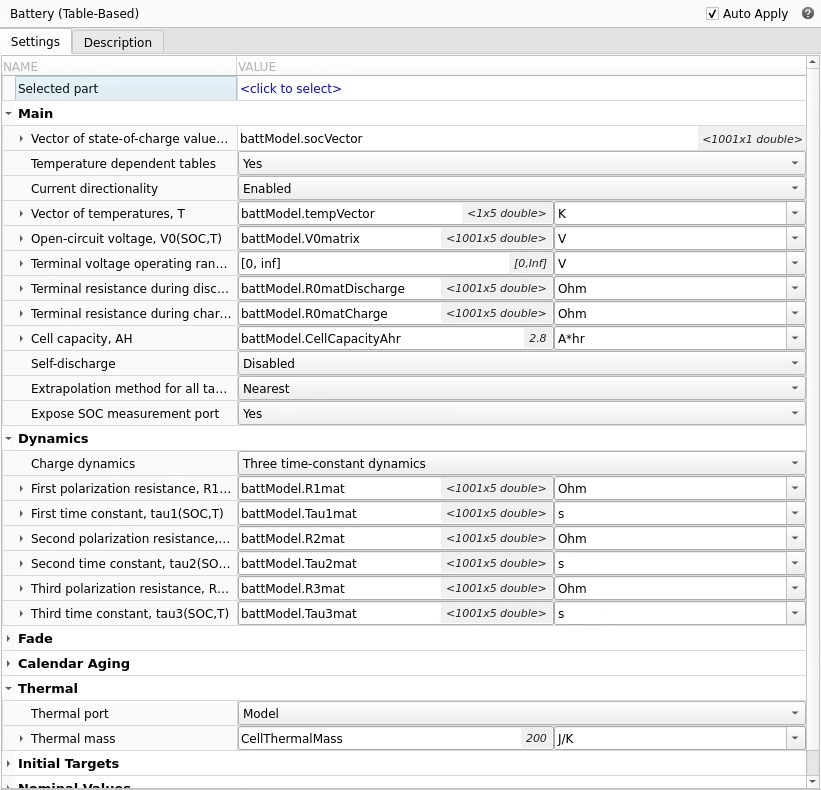
设置电池容量、热质量、初始温度和初始 SOC。电芯的温度取决于 CellThermalMass,该值等于 200 J/K。
CellCapacityAhr = 2.8;
CellThermalMass = 200;
InitialTemperature = 305;
InitialSOC = 1;
load("ocvData.mat")
在给定的 InitialTemperature 条件下,以不同的 C 率进行恒定电流放电。
legendStr = strings(1,numCases);
battSensorData = cell(1,numCases);
运行所有仿真。
caseNum = 0;
for C_rate = C_rate_min:C_rate_del:C_rate_max
    caseNum = caseNum + 1;
    legendStr(1,caseNum) = strcat(num2str(C_rate),'C rate discharge case');
    BatteryConstantCurrent = -C_rate*CellCapacityAhr;
    batterySimTime_s = oneHr/C_rate;
    sim('CellDischargeCC');
    ts      = simlog_CellDischargeCC.battery.batteryVoltage.series.time;
    voltage = simlog_CellDischargeCC.battery.batteryVoltage.series.values;
    tempK   = simlog_CellDischargeCC.battery.batteryTemperature.series.values;
    battSensorData{1,caseNum} = [ts voltage tempK];
end
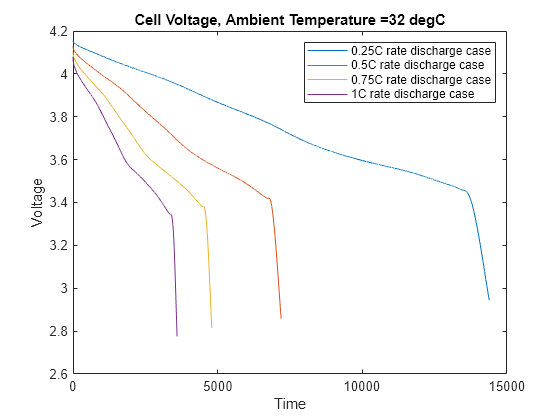
绘制不同恒定电流放电情况下的电池电压曲线。
titleDisplay = strcat('Cell Voltage, Ambient Temperature = ',num2str(InitialTemperature-273),' degC');
figure('Name', titleDisplay);
for itr = 1:numCases
    plot(battSensorData{1,itr}(:,1),battSensorData{1,itr}(:,2)); hold on
end
hold off
legend(legendStr);
xlabel('Time');
ylabel('Voltage');
title(titleDisplay);

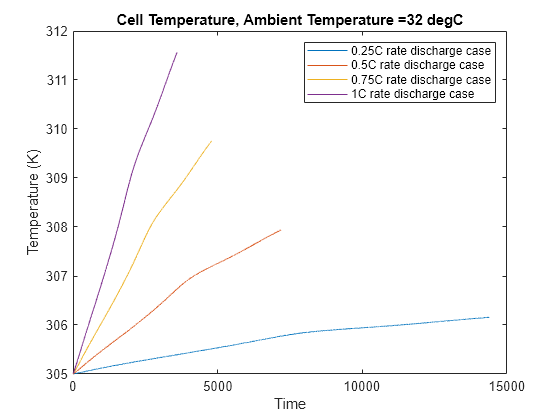
绘制恒流放电工况下的电池温升曲线。
titleDisplay = strcat('Cell Temperature, Ambient Temperature = ',num2str(InitialTemperature-273),' degC');
figure('Name', titleDisplay);
for itr = 1:numCases
    plot(battSensorData{1,itr}(:,1),battSensorData{1,itr}(:,3)); hold on
end
hold off
legend(legendStr);
xlabel('Time');
ylabel('Temperature (K)');
title(titleDisplay);

参考资料
Christophersen, Jon P."Battery Test Manual For Electric Vehicles, Revision 3".United States:N. p., 2015.Web. doi:10.2172/1186745
Zhengzhou Bak Battery Co.,LTD, "Specification For Lithium-ion Rechargeable Cell.Cell Type :N18650CL-29".
Anandaroop Bhattacharya, Subhasish Basu Majumder."Experimental data collected with Biologic BCS-815 8-channel battery tester for battery HPPC test".Indian Institute of Technology (IIT) Kharagpur, India.

