loss
Regression error for regression tree model
Syntax
Description
L = loss(___,Name=Value)
Examples
Compute the In-Sample MSE
Load the carsmall data set. Consider Displacement, Horsepower, and Weight as predictors of the response MPG.
load carsmall
X = [Displacement Horsepower Weight];
Grow a regression tree using all observations.
tree = fitrtree(X,MPG);
Estimate the in-sample MSE.
L = loss(tree,X,MPG)
L = 4.8952
Find the Pruning Level Yielding the Optimal In-Sample Loss
Load the carsmall data set. Consider Displacement, Horsepower, and Weight as predictors of the response MPG.
load carsmall
X = [Displacement Horsepower Weight];
Grow a regression tree using all observations.
Mdl = fitrtree(X,MPG);
View the regression tree.
view(Mdl,Mode="graph");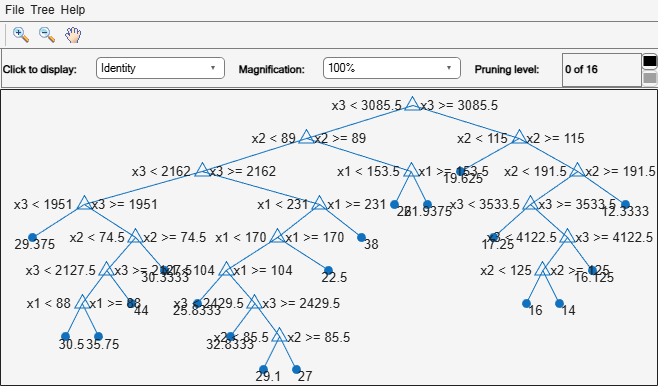
Find the best pruning level that yields the optimal in-sample loss.
[L,se,NLeaf,bestLevel] = loss(Mdl,X,MPG,Subtrees="all");
bestLevel
bestLevel = 1
The best pruning level is level 1.
Prune the tree to level 1.
pruneMdl = prune(Mdl,Level=bestLevel);
view(pruneMdl,Mode="graph");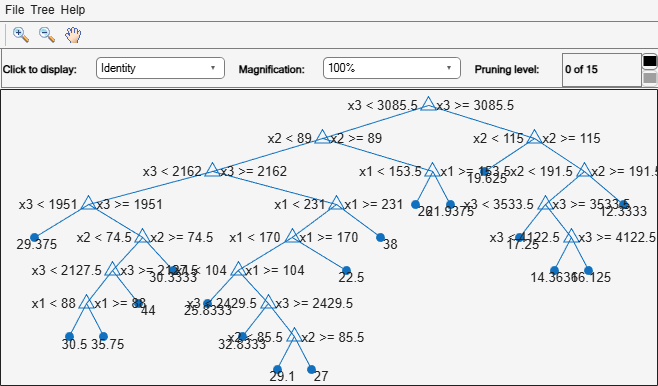
Examine the MSE for Each Subtree
Unpruned decision trees tend to overfit. One way to balance model complexity and out-of-sample performance is to prune a tree (or restrict its growth) so that in-sample and out-of-sample performance are satisfactory.
Load the carsmall data set. Consider Displacement, Horsepower, and Weight as predictors of the response MPG.
load carsmall
X = [Displacement Horsepower Weight];
Y = MPG;
Partition the data into training (50%) and validation (50%) sets.
n = size(X,1);
rng(1) % For reproducibility
idxTrn = false(n,1);
idxTrn(randsample(n,round(0.5*n))) = true; % Training set logical indices
idxVal = idxTrn == false;                  % Validation set logical indices
Grow a regression tree using the training set.
Mdl = fitrtree(X(idxTrn,:),Y(idxTrn));
View the regression tree.
view(Mdl,Mode="graph");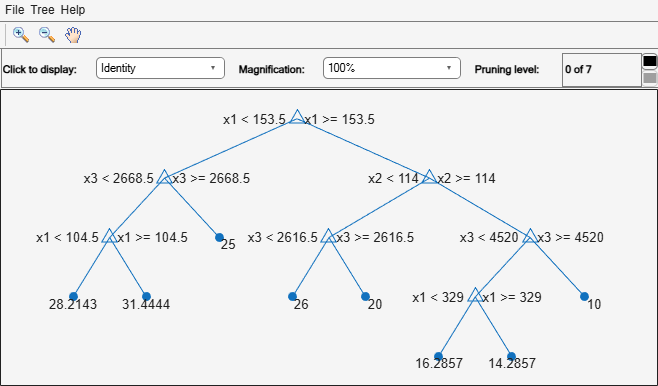
The regression tree has seven pruning levels. Level 0 is the full, unpruned tree (as displayed). Level 7 is just the root node (i.e., no splits).
Examine the training sample MSE for each subtree (or pruning level) excluding the highest level.
m = max(Mdl.PruneList) - 1;
trnLoss = resubLoss(Mdl,SubTrees=0:m)
trnLoss = 7×1

    5.9789
    6.2768
    6.8316
    7.5209
    8.3951
   10.7452
   14.8445
The MSE for the full, unpruned tree is about 6 units.
The MSE for the tree pruned to level 1 is about 6.3 units.
The MSE for the tree pruned to level 6 (i.e., a stump) is about 14.8 units.
Examine the validation sample MSE at each level excluding the highest level.
valLoss = loss(Mdl,X(idxVal,:),Y(idxVal),Subtrees=0:m)
valLoss = 7×1

   32.1205
   31.5035
   32.0541
   30.8183
   26.3535
   30.0137
   38.4695
The MSE for the full, unpruned tree (level 0) is about 32.1 units.
The MSE for the tree pruned to level 4 is about 26.4 units.
The MSE for the tree pruned to level 5 is about 30.0 units.
The MSE for the tree pruned to level 6 (i.e., a stump) is about 38.5 units.
To balance model complexity and out-of-sample performance, consider pruning Mdl to level 4.
pruneMdl = prune(Mdl,Level=4);
view(pruneMdl,Mode="graph")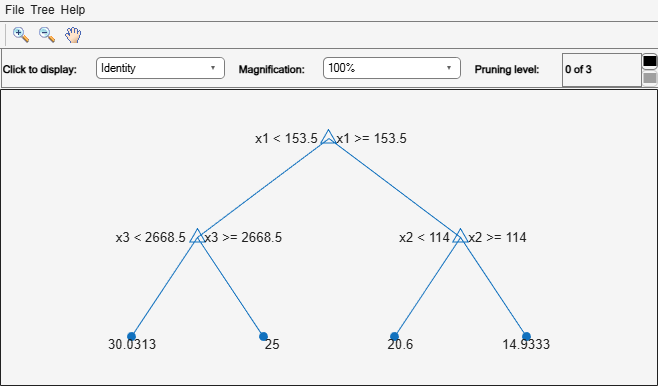
Input Arguments
Output Arguments
More About
Extended Capabilities
Version History
Introduced in R2011a
See Also
You can also select a web site from the following list:
Americas
- América Latina (Español)
- Canada (English)
- United States (English)
Europe
- Belgium (English)
- Denmark (English)
- Deutschland (Deutsch)
- España (Español)
- Finland (English)
- France (Français)
- Ireland (English)
- Italia (Italiano)
- Luxembourg (English)
- Netherlands (English)
- Norway (English)
- Österreich (Deutsch)
- Portugal (English)
- Sweden (English)
- Switzerland
- United Kingdom (English)