ecdf
Compute empirical cumulative distribution function (ecdf) for baseline and target data specified for data drift detection
Since R2022a
Description
E = ecdf(DDiagnostics)E, which stores the ecdf values for all the variables
specified for drift detection in the call to the detectdrift
function.
ecdf returns NaN values for categorical
variables.
E = ecdf(DDiagnostics,Variables=variables)E for the variables specified by
variables.
Examples
Generate baseline and target data with two variables, where the distribution parameters of the second variable change for the target data.
rng('default') % For reproducibility
baseline = [normrnd(0,1,100,1),wblrnd(1.1,1,100,1)];
target = [normrnd(0,1,100,1),wblrnd(1.2,2,100,1)];
Perform permutation testing for any drift between the baseline and target data.
DDiagnostics = detectdrift(baseline,target)
DDiagnostics =
  DriftDiagnostics

              VariableNames: ["x1"    "x2"]
       CategoricalVariables: []
                DriftStatus: ["Stable"    "Drift"]
                    PValues: [0.2850 0.0030]
        ConfidenceIntervals: [2×2 double]
    MultipleTestDriftStatus: "Drift"
             DriftThreshold: 0.0500
           WarningThreshold: 0.1000


  Properties, Methods
Compute the ecdf values for all variables.
E = ecdf(DDiagnostics)
E=2×3 table
                x             F_Baseline         F_Target
          ______________    ______________    ______________

    x1    {201×1 double}    {201×1 double}    {201×1 double}
    x2    {201×1 double}    {201×1 double}    {201×1 double}
E is a table with two rows and three columns. The two rows correspond to the two variables, x1 and x2. For each variable, ecdf computes the ecdf values over a common domain for the baseline and target data. The function stores the common domain for each variable in the column x, the ecdf values for the baseline data in the column F_Baseline, and the ecdf values for the target data in the column F_Target.
Access the ecdf values for variable 2 in the baseline data.
E.F_Baseline{2}ans = 201×1
0
0.0100
0.0100
0.0200
0.0300
0.0400
0.0500
0.0600
0.0700
0.0800
⋮
Plot the ecdf values of the baseline and target data for variable x2.
stairs(E.x{2},E.F_Baseline{2},LineWidth=1.5)
hold on
stairs(E.x{2},E.F_Target{2},LineWidth=1.5)
title('ECDF for x2')
xlabel('x2')
ylabel('Empirical CDF')
legend('Baseline','Target',Location='east')
hold off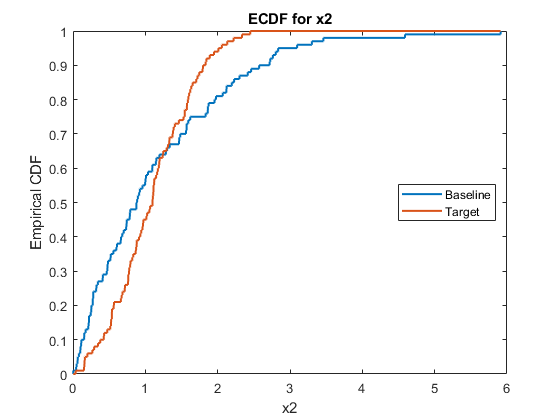
The plot of the ecdf values also shows the drift in the distribution of the target data.
Load the sample data.
load humanactivityFor details on the data set, enter Description at the command line.
Assign the first 1000 observations as baseline data and the next 1000 as target data.
baseline = feat(1:1000,:);
target = feat(1001:2000,:);
Test for drift on all variables.
DDiagnostics = detectdrift(baseline,target);
Compute the ecdf values for only the first five variables.
E = ecdf(DDiagnostics,Variables=[1:5])
E=5×3 table
                 x             F_Baseline          F_Target
          _______________    _______________    _______________

    x1    {2001×1 double}    {2001×1 double}    {2001×1 double}
    x2    {2001×1 double}    {2001×1 double}    {2001×1 double}
    x3    {2001×1 double}    {2001×1 double}    {2001×1 double}
    x4    {2001×1 double}    {2001×1 double}    {2001×1 double}
    x5    {2001×1 double}    {2001×1 double}    {2001×1 double}
Access the ecdf values for the third variable in the baseline data.
E.F_Baseline{3}ans = 2001×1
0
0
0
0
0
0
0.0010
0.0020
0.0030
0.0040
⋮
Plot the ecdf values of the baseline and target data for variable x3.
stairs(E.x{3},E.F_Baseline{3},LineWidth=1.5)
hold on
stairs(E.x{3},E.F_Target{3},LineWidth=1.5)
title('ECDF for x3')
xlabel('x3')
ylabel('Empirical CDF')
legend('Baseline','Target',Location = 'southeast')
hold off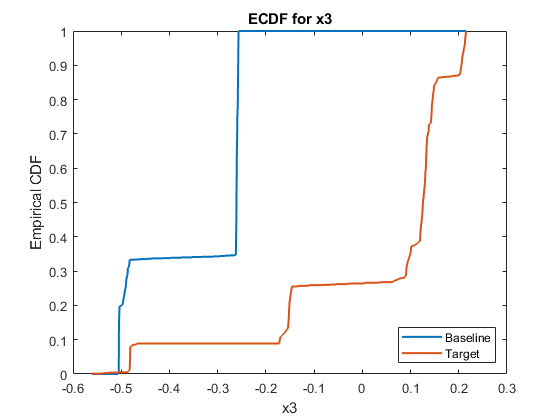
The ecdf plot shows the drift in the target data for variable x3.
Input Arguments
Output Arguments
Version History
Introduced in R2022a
See Also
detectdrift | DriftDiagnostics | plotDriftStatus | plotEmpiricalCDF | plotHistogram | plotPermutationResults | summary | histcounts