show
Visualize normal distributions transform (NDT) map
Description
show( visualizes the NDT map
as a point cloud. The function uses voxel means, covariances, and point counts
to generate points for the display. These points are not the points used to
build the map. The NDT map is a compressed representation of the point cloud map
that stores the voxels and their 3-D normal distributions.ndtMap)
show(
displays points within the spatial map or submap specified by
ndtMap,spatialExtent)spatialExtent.
show(___,
specifies options using one or more name-value arguments in addition to any
combination of input arguments in previous syntaxes. For example,
Name,Value)'MarkerSize',6 sets the marker size to
6 points.
ax = show(___)
Examples
Load an NDT map from a MAT file.
data = load('ndtMapParkingLot.mat');
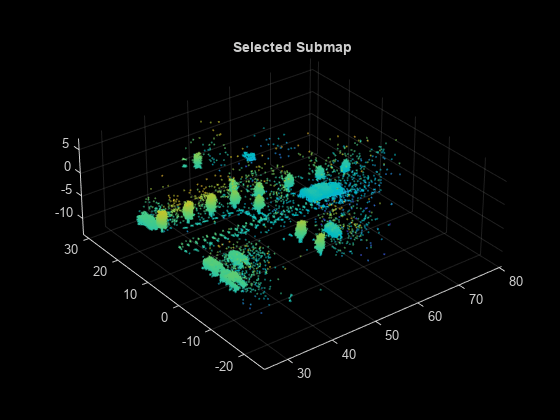
ndtMap = data.ndtMapParkingLot;Select a submap from within the loaded NDT map at the specified location and size.
center  = [50  0  0];
sz      = [50 50 10];
ndtMap = selectSubmap(ndtMap,center,sz);
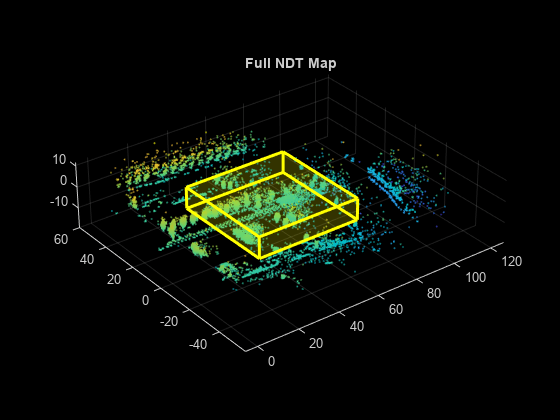
Visualize the full NDT map.
figure
show(ndtMap)
title('Full NDT Map')
Highlight the selected submap on the full NDT map.
pos = [center,sz,zeros(1, 3)];
showShape('cuboid',pos,'Color','y','Opacity',0.2);
Visualize the selected submap.
figure
show(ndtMap,'submap')
title('Selected Submap')
Input Arguments
Name-Value Arguments
Output Arguments
Version History
Introduced in R2021a