showMatchedFeatures
R2026bDisplay corresponding feature points
Syntax
Description
showMatchedFeatures(
displays an overlay of images I1,I2,matchedPoints1,matchedPoints2)I1 and
I2 with a color-coded plot of corresponding points
connected by a line. matchedPoints1 and
matchedPoints2 contain the coordinates of corresponding
points in I1 and I2.
showMatchedFeatures( displays
images I1,I2,matchedPoints1,matchedPoints2,method)I1 and I2 using the
visualization style specified by the method parameter.
showMatchedFeatures(___,
lets you specify custom plot options in a cell array containing three values.
The PlotOptions,
{MarkerStyle1, MarkerStyle2, LineStyle})MarkerStyle1, MarkerStyle2,
and LineStyle values correspond to the marker symbol in
I1, marker symbol in I2, and the
line style and color. The LineSpec syntax of the plot function defines each of the
specifiers.
showMatchedFeatures(___,
specifies options using one or more name-value arguments in addition to any
combination of arguments from previous syntaxes. For example,
Name=Value)showMatchedFeatures(__,PlotOptions={"d","+","g"}) sets
the marker style to a diamond for I1, a plus sign for
I2, and the color to green.
H = showMatchedFeatures(___)showMatchedFeatures.
Examples
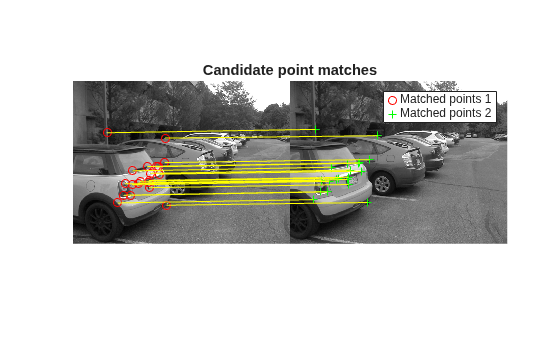
Read images.
I1 = im2gray(imread("parkinglot_left.png"));
I2 = im2gray(imread("parkinglot_right.png"));
Detect Harris features.
points1 = detectHarrisFeatures(I1);
points2 = detectHarrisFeatures(I2);
Extract features.
[f1,vpts1] = extractFeatures(I1,points1);
[f2,vpts2] = extractFeatures(I2,points2);
Match features.
indexPairs = matchFeatures(f1,f2);
matchedPoints1 = vpts1(indexPairs(1:20,1));
matchedPoints2 = vpts2(indexPairs(1:20,2));
Visualize candidate matches.
figure;
showMatchedFeatures(I1,I2,matchedPoints1,matchedPoints2,"montage");
title("Candidate point matches");
legend("Matched points 1","Matched points 2");
Read images.
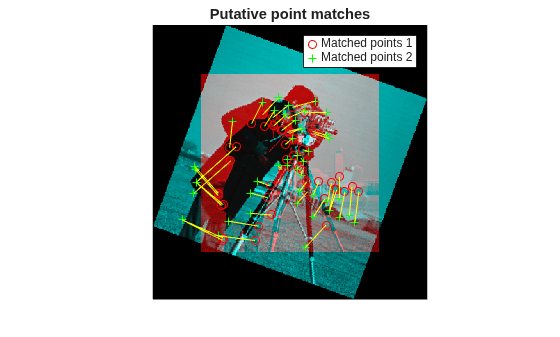
I1 = imread("cameraman.tif");
I2 = imresize(imrotate(I1,-20), 1.2);
Detect SURF features.
points1 = detectSURFFeatures(I1);
points2 = detectSURFFeatures(I2);
Extract features.
[f1,vpts1] = extractFeatures(I1,points1);
[f2,vpts2] = extractFeatures(I2,points2);
Match features.
indexPairs = matchFeatures(f1,f2);
matchedPoints1 = vpts1(indexPairs(:,1));
matchedPoints2 = vpts2(indexPairs(:,2));
Visualize candidate matches.
figure;
showMatchedFeatures(I1,I2,matchedPoints1,matchedPoints2);
title("Putative point matches");
legend("Matched points 1","Matched points 2");
Input Arguments
Name-Value Arguments
Output Arguments
Version History
Introduced in R2012b

