


- /
-
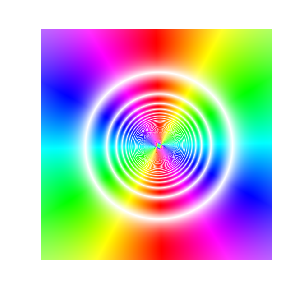
Complex Bounce
on 30 Nov 2023
- 13
- 20
- 0
- 0
- 588
drawframe(24);
Write your drawframe function below
function drawframe(f)
%% Complex domain plot
%% Reference: https://copyprogramming.com/howto/how-can-i-generate-this-domain-coloring-plot
num_frames = 48;
range = pi; % xy limits
res = 4000; % resolution
t = (f-1)./(num_frames-1);
fun = @(Z) 1./(Z+1i*sin(2*pi*t)).^2 + 1./(Z-2*sin(2*pi*t)).^2;
imshow(domainPlot(fun,pi,res));
% generate grid
function Z = getComplexGrid(range, n)
r = linspace(-range, range, n);
[X, Y] = meshgrid(r, -r);
Z = complex(X,Y);
end
% calcualte HSV values
function HSV = getComplexHSB(Z)
h = (angle(Z)+pi+0.05)/ (2 * pi);
s = abs(sin(2 * pi * abs(Z)));
v = ones(size(Z));
HSV = cat(3,h,s, v);
end
function aaImage = domainPlot(func, range, n)
Z = getComplexGrid(range, n);
fZ = func(Z);
HSB = getComplexHSB(fZ);
rgbImage = hsv2rgb(HSB);
aaImage = imresize(rgbImage, [n/2 n/2], 'method', 'bilinear');
end
end
Animation


