主要内容

altitudeSpeedEnvelope

Plot altitude versus airspeed flight envelope

Since R2026a

Description

ax = altitudeSpeedEnvelope(CLmax,hMax,Vmax,S,mass) creates a plot axes object, ax, and plots the altitude versus airspeed flight envelope given maximum lift coefficient, maximum altitude, maximum airspeed, wing area, and mass.

ax = altitudeSpeedEnvelope(___,Name=Value) specifies options using one or more name-value arguments in addition to the input arguments in previous syntaxes.

altitudeSpeedEnvelope(myAx,___) plots a boundary line on the specified axes myAx instead of the current axes. Create myAx with any axes function, such as gca or axes.

example

Examples

collapse all

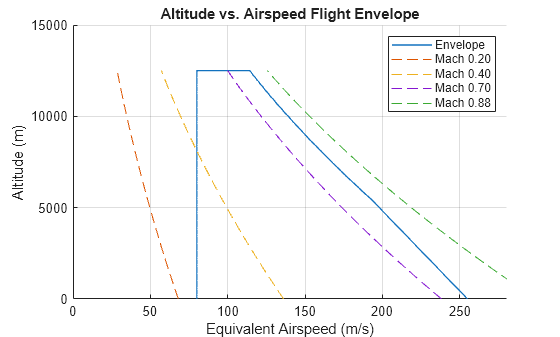
Create an altitude flight envelope (H-M diagram) for a Boeing 737 aircraft with an equivalent airspeed (EAS) x-axis.

ax = altitudeSpeedEnvelope(1.6,12500,255,125,80000, ...
   MachLines=[0.2,0.4,0.7,0.88],XAxis="EAS",MachMax=0.8)

Figure contains an axes object. The axes object with title Altitude vs. Airspeed Flight Envelope, xlabel Equivalent Airspeed (m/s), ylabel Altitude (m) contains 5 objects of type line. These objects represent Envelope, Mach 0.20, Mach 0.40, Mach 0.70, Mach 0.88.

ax = 
  Axes (Altitude vs. Airspeed Flight Envelope) with properties:

             XLim: [0 280.5000]
             YLim: [0 15000]
           XScale: 'linear'
           YScale: 'linear'
    GridLineStyle: '-'
         Position: [0.1300 0.1127 0.7750 0.8123]
            Units: 'normalized'

  Show all properties

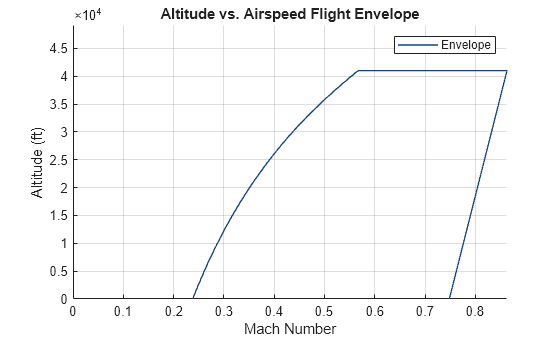
Create an altitude flight envelope (H-M diagram) for a Boeing 737 aircraft with a Mach x-axis.

altitudeSpeedEnvelope(1.6,41000,495,1340,180000, ...
  Units="English (kts)",XAxis="Mach",Atmosphere="COESA", ...
  ColorOrder="earth")

Figure contains an axes object. The axes object with title Altitude vs. Airspeed Flight Envelope, xlabel Mach Number, ylabel Altitude (ft) contains an object of type line. This object represents Envelope.

ans = 
  Axes (Altitude vs. Airspeed Flight Envelope) with properties:

             XLim: [0 Inf]
             YLim: [0 49200]
           XScale: 'linear'
           YScale: 'linear'
    GridLineStyle: '-'
         Position: [0.1300 0.1127 0.7750 0.8123]
            Units: 'normalized'

  Show all properties

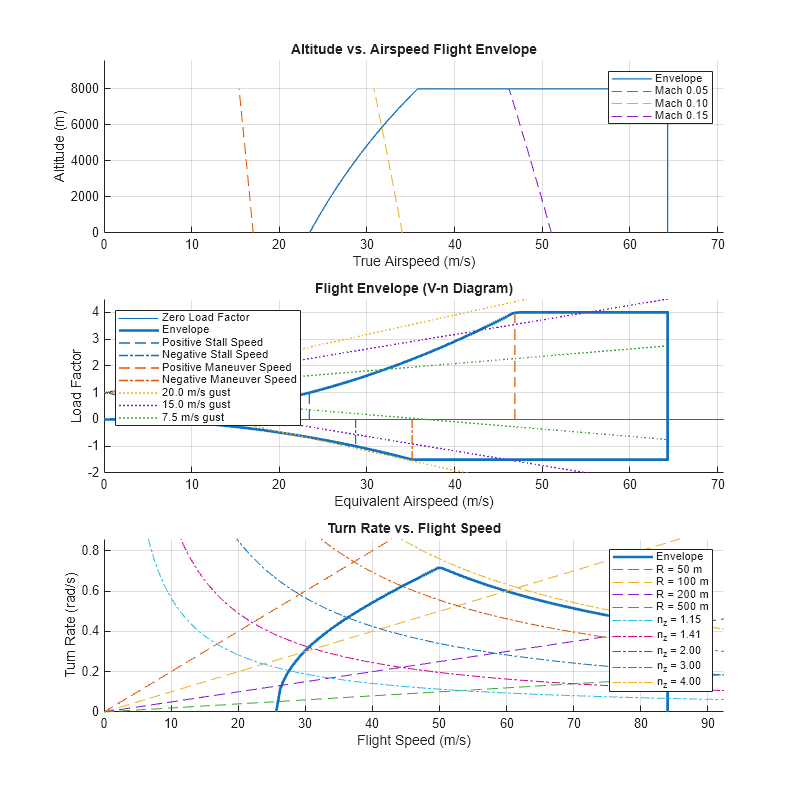
Create three flight envelopes and plot them on tiled axes ax1, ax2, and ax3 using the tiledlayout and nexttile functions.

Create a figure specifying the left, bottom, width, and height positions.

figure('Units','inches','Position',[1,1,12,12]);

Create a 3-row, 1-column, loosely tiled chart layout using tiledlayout.

tiledlayout(3,1);

Set the first tile to ax1 using nexttile, and then create and plot the altitude versus airspeed flight envelope using the altitudeSpeedEnvelope function.

ax1 = nexttile;
altitudeSpeedEnvelope(ax1,1.8,8000,64.3,16.2,1000,MachLines=[0.05,0.1,0.15]);

Set the second tile to ax2 using nexttile and then create and plot the airspeed versus load factor flight envelope using velocityLoadFactorEnvelope.

ax2 = nexttile;
velocityLoadFactorEnvelope(ax2,0,1000,16.2,1.5,64.3,[-1.2,1.8],[-1.5,4],XAxis="EAS");

Set the third tile to ax3 using the nexttile function, and then create and plot the turn rate versus flight speed flight envelope using the turnRateAirspeedEnvelope function.

ax3 = nexttile;
turnRateAirspeedEnvelope(ax3,1.5,16.2,1000,3.8,84);

Figure contains 3 axes objects. Axes object 1 with title Altitude vs. Airspeed Flight Envelope, xlabel True Airspeed (m/s), ylabel Altitude (m) contains 4 objects of type line. These objects represent Envelope, Mach 0.05, Mach 0.10, Mach 0.15. Axes object 2 with title Flight Envelope (V-n Diagram), xlabel Equivalent Airspeed (m/s), ylabel Load Factor contains 9 objects of type line. These objects represent Zero Load Factor, Envelope, Positive Stall Speed, Negative Stall Speed, Positive Maneuver Speed, Negative Maneuver Speed, 20.0 m/s gust, 15.0 m/s gust, 7.5 m/s gust. Axes object 3 with title Turn Rate vs. Flight Speed, xlabel Flight Speed (m/s), ylabel Turn Rate (rad/s) contains 10 objects of type line. These objects represent Envelope, R = 50 m, R = 100 m, R = 200 m, R = 500 m, n_z = 1.15, n_z = 1.41, n_z = 2.00, n_z = 3.00, n_z = 4.00.

Input Arguments

collapse all

Maximum lift coefficient, specified as a scalar.

Data Types: double

Maximum altitude, specified as a scalar, in the units specified in Units.

Data Types: double

Maximum true airspeed (TAS), specified as a scalar, in the units specified in Units.

Data Types: double

Wing area, specified as a scalar in the units specified in Units.

Data Types: double

Aircraft mass, specified as a scalar, in the units specified in Units.

Data Types: double

Created axis handle, specified as a scalar. Create myAx with any axes function, such as gca or axes.

Name-Value Arguments

collapse all

Specify optional pairs of arguments as Name1=Value1,...,NameN=ValueN, where Name is the argument name and Value is the corresponding value. Name-value arguments must appear after other arguments, but the order of the pairs does not matter.

Example: Units="English (kts)"

Input and plot units, specified as one of these values:

  • "Metric"

  • "English (kts)"

  • "English (ft/s)"

Mach numbers to plot Mach lines, specified as a 1-by-n array.

Data Types: double

Maximum Mach number, specified as a scalar.

Data Types: double

Maximum dynamic pressure, specified as a scalar, in the units specified in Units.

Data Types: double

Minimum altitude, specified as a scalar, in the units specified in Units.

Data Types: double

Acceleration due to gravity, specified as a scalar. The function recalculates the default value based on the units specified in Units.

Data Types: double

x-axis variable, specified as one of these values:

  • "TAS" — True airspeed

  • "EAS" — Equivalent airspeed

  • "Mach" — Ratio of the aircraft true airspeed to the local speed of sound.

Atmospheric model to compute air properties at altitude, specified as one of these values:

  • "ISA" — International Standard Atmosphere

  • "COESA" — Committee on Extension to the Standard Atmosphere

Color palette for the output plot, specified as one of these values:

  • colorarray — Color array, specified as a matrix of RGB triplets or a color name.

  • palettename — Predefined colororder palette name, specified as "gem", "gem12", "glow", "glow12", "sail", "reef", "meadow", "dye", or "earth".

These values must be valid inputs for the colororder function. For more information, see colororder.

Data Types: double

Option to replace default line plot with boundaryline function to draw the envelope, specified as "on" to have altitudeSpeedEnvelope draw the plot with hatches.

Data Types: double

Output Arguments

collapse all

Axes handle, returned as a scalar.

Version History

Introduced in R2026a