colororder
设置或查询色序调色板
语法
说明
设置颜色
colororder( 为当前图窗的色序设置调色板。色序控制 MATLAB® 用来在坐标区内绘制多个数据序列时所用的颜色的排序。colorarray)
将 colorarray 指定为 RGB 三元组矩阵或颜色名称数组,如 ["red" "green" "blue"]。如果图窗不存在,MATLAB 会创建一个图窗并为该图窗设置调色板。当您为图窗设置调色板时,会为该图窗中的所有坐标区设置调色板。
colororder( 将颜色指定为预定义调色板名称之一,例如 palettename)"gem"、"glow" 或 "sail"。 (自 R2023b 起)
示例
将图窗的色序设置为四种颜色。定义一个 x 坐标向量和四个 y 坐标向量。然后绘制每组坐标。
newcolors = [0.83 0.14 0.14
             1.00 0.54 0.00
             0.47 0.25 0.80
             0.25 0.80 0.54];

colororder(newcolors)

% Define coordinates
x = linspace(0,10);
y1 = sin(x);
y2 = sin(x-0.5);
y3 = sin(x-1);
y4 = sin(x-1.5);

% Plot coordinates
plot(x,y1,'LineWidth',2)
hold on
plot(x,y2,'LineWidth',2)
plot(x,y3,'LineWidth',2)
plot(x,y4,'LineWidth',2)
hold off
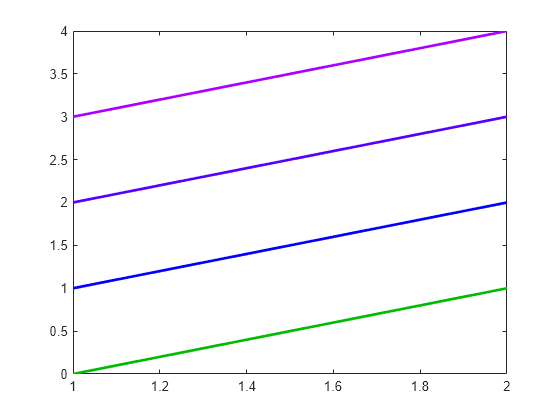
创建一个由 x 坐标组成的向量和一个由 y 坐标组成的矩阵。然后绘制坐标。
x = [1 2];
y = [0 1 2 3; 1 2 3 4];
plot(x,y,"LineWidth",2)
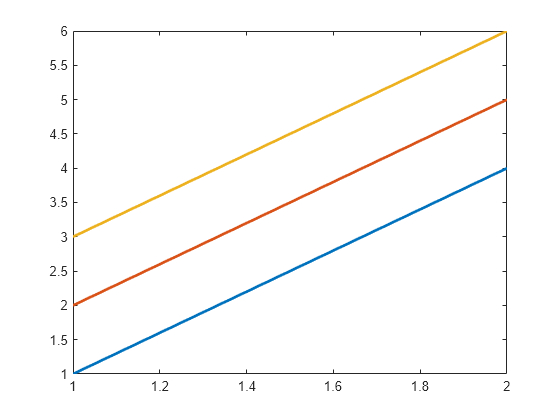
通过向 colororder 函数传递四个十六进制颜色代码来更改绘图的颜色。
newcolors = ["#0B0" "#00F" "#50F" "#A0F"];
colororder(newcolors)
您也可以指定几个命名的调色板之一。将颜色更改为名为 sail 的调色板。
colororder("sail")
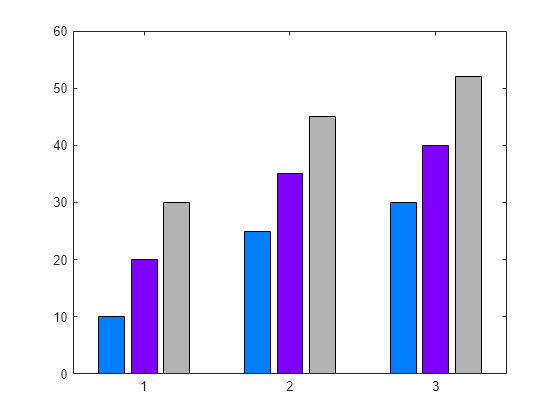
显示三个条形序列。然后将色序设置为蓝色、紫色和灰色。
bar([10 20 30; 25 35 45; 30 40 52])
newcolors = [0 0.5 1; 0.5 0 1; 0.7 0.7 0.7];
colororder(newcolors)
在调用 yyaxis 之前设置图窗的色序会为每个 y 轴设置颜色。左侧使用第一种颜色,右侧使用第二种颜色。如果指定两种以上的颜色,则任一侧都不会使用多余的颜色。
将 newcolors 定义为包含两个 RGB 三元组的矩阵。设置图窗的色序,并基于左侧绘制两条线。然后基于右侧绘制两条线。
newcolors = [0.40 0.30 0.90; 0.50 0.65 0.15];
colororder(newcolors)

% Left side
yyaxis left
plot([1 2; 3 4])

% Right side
yyaxis right
plot([4 3; 2 1])

在调用 yyaxis 之后设置图窗的色序会为活动侧设置颜色。
激活左侧 y 轴并绘制三条线。将线型序列设置为实线,并将左侧 y 轴颜色更改为蓝色。然后将色序设置为三个蓝色梯度。
% Left side
yyaxis left
plot([1 2 3; 4 5 6])
ax = gca;
ax.LineStyleOrder = '-';
ax.YColor = 'blue';
leftcolors = [0 0 1; 0 0.50 1; 0 0.80 1];
colororder(leftcolors)

激活右侧 y 轴并绘制两条线。将右侧 y 轴颜色更改为黑色。然后将色序设置为黑色。
% Right side
yyaxis right
plot([4 3; 2 1])
ax.YColor = 'black';
colororder('black')

当使用颜色参量调用绘图函数时,绘图函数会使用该颜色,而不是使用色序中的下一种颜色。
将图窗的色序设置为红色、品红色和蓝色。调用 scatter 函数以绘制一组散点。然后绘制第二组散点,并将标记指定为黑色星号。
newcolors = {'red','magenta','blue'};
colororder(newcolors)
scatter(1:10,rand(1,10),'filled')
hold on
scatter(1:10,rand(1,10),'*k')
绘制第三组散点,不指定标记颜色。请注意,这组散点使用色序中的第三个颜色,即蓝色。
scatter(1:10,rand(1,10),'filled')
hold off

创建分块图布局,并在第一个图块中绘制三条线。
tiledlayout('flow')
nexttile
plot([1 2 3; 4 5 6],'LineWidth',2)
带返回参量调用 nexttile 函数,以获取第二个图块的坐标区对象。在第二个图块中绘制三条线。然后获取坐标区的色序矩阵,并在 C 中返回输出。将 C 中的第一种颜色更改为紫色,并将坐标区色序设置为修改后的 C 矩阵。
ax = nexttile;
plot(ax,[4 5 6; 1 2 3],'LineWidth',2)
C = colororder(ax);
C(1,:) = [0.5 0 1];
colororder(ax,C)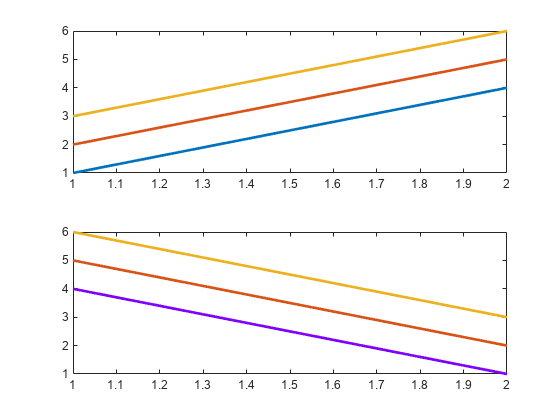
自 R2023b 起
使用命名的调色板可以方便地更改图的颜色。此示例比较分块图布局中的四个不同调色板。
通过调用 nexttile 函数创建包含一个坐标区对象的分块图布局。然后使用默认调色板 gem 创建一个随机数条形图。
nexttile
bar(rand(3,5))
title("gem")
使用 reef、meadow 和 earth 调色板创建另外三个条形图。要指定不同坐标区的颜色,您必须将坐标区对象传递给 colororder 函数。要获取坐标区对象,请在调用 nexttile 时指定输出参量。
ax2 = nexttile;
bar(rand(3,5))
colororder(ax2,"reef")
title("reef")

ax3 = nexttile;
bar(rand(3,5))
colororder(ax3,"meadow")
title("meadow")

ax4 = nexttile;
bar(rand(3,5))
colororder(ax4,"earth")
title("earth")

输入参数
颜色数组,指定为一个 RGB 三元组矩阵、一个颜色名称数组。
RGB 三元组矩阵
指定一个 m×3 矩阵,其中每行都是一个 RGB 三元组。RGB 三元组是一个三元素向量,包含颜色的红、绿和蓝分量的强度。强度必须处于范围 [0,1] 中。例如,以下矩阵将新颜色定义为蓝色、深绿色和橙色:
colorarray = [1.0 0.0 0.0
             0.0 0.4 0.0
             1.0 0.5 0.0];
由颜色名称或十六进制颜色代码组成的数组
指定颜色名称、短名称或十六进制颜色代码的任意组合。
要指定一种颜色,请将
colorarray设置为字符向量或字符串标量。例如,colorarray = 'red'将红色指定为色序中的唯一颜色。要指定多种颜色,请将
colorarray设置为字符向量元胞数组或字符串数组。例如,colorarray = {'red','green','blue'}将颜色指定为红色、绿色和蓝色。
十六进制颜色代码以井号 (#) 开头,后跟三个或六个 0 到 F 范围内的十六进制数字。这些值不区分大小写。因此,颜色代码 '#FF8800' 与 '#ff8800'、'#F80' 与 '#f80' 是等效的。
下表列出了颜色名称和短名称,以及等效的 RGB 三元组和十六进制颜色代码。
| 颜色名称 | 短名称 | RGB 三元组 | 十六进制颜色代码 | 外观 |
|---|---|---|---|---|
"red" | "r" | [1 0 0] | "#FF0000" |
|
"green" | "g" | [0 1 0] | "#00FF00" |
|
"blue" | "b" | [0 0 1] | "#0000FF" |
|
"cyan" | "c" | [0 1 1] | "#00FFFF" |
|
"magenta" | "m" | [1 0 1] | "#FF00FF" |
|
"yellow" | "y" | [1 1 0] | "#FFFF00" |
|
"black" | "k" | [0 0 0] | "#000000" |
|
"white" | "w" | [1 1 1] | "#FFFFFF" |
|


数据类型: single | double | char | cell | string
自 R2023b 起
预定义的调色板名称,指定为下表中的值之一或 "default"(与 "gem" 相同)。
| 调色板名称 | 调色板颜色 |
|---|---|
|
|
|
|
|
|
|
|
|
|
|
|
|
|
|
|
|
|


目标,指定为下列值之一:
图窗。新颜色会影响图窗中所有坐标区的内容。
任何类型的坐标区对象:
Axes、PolarAxes或GeographicAxes对象。新颜色仅影响指定坐标区的内容。独立可视化,例如由
bubblecloud、piechart、donutchart、stackedplot、scatterhistogram、parallelplot或geobubble函数创建的图。
提示
如果您为图窗设置了色序,则在您调用绘图函数时颜色保持不变。但是,如果将坐标区对象传递给
colororder函数,您必须首先调用hold on才能使颜色在您调用绘图函数时保持不变。如果对坐标区设置了
ColorOrderIndex或LineStyleOrderIndex属性,新色序不会影响现有绘图。只有在您调用hold on然后调用绘图函数之后,新颜色才会生效。
版本历史记录
在 R2019b 中推出"gem" 调色板颜色略有更改。下表列出了这些更改。
| R2024b 颜色 | R2025a 颜色 | ||||||||||||||||||||||||||||||||
|---|---|---|---|---|---|---|---|---|---|---|---|---|---|---|---|---|---|---|---|---|---|---|---|---|---|---|---|---|---|---|---|---|---|
|
|


