主要内容

speechIntelligibilityIndex

R2026b

Measure speech audibility using speech intelligibility index (SII) metric

Since R2026b

    Description

    sii = speechIntelligibilityIndex() computes the SII using standard speech levels according to the ANSI/ASA S3.5-1997 standard [1].

    example

    sii = speechIntelligibilityIndex(ir,fs) computes the SII from a room impulse response.

    example

    sii = speechIntelligibilityIndex(processed,reference,fs) computes the SII from signals processed by an acoustic system and the reference excitation signals.

    example

    [sii,baf] = speechIntelligibilityIndex(___) also returns the band audibility function (BAF).

    example

    [sii,baf,mtf] = speechIntelligibilityIndex(___) also returns the modulation transfer function (MTF). The MTF output is available only when you specify an impulse response or a pair of processed and reference signals.

    [___] = speechIntelligibilityIndex(___,Name=Value) specifies options using one or more name-value arguments, such as the filter bank method. Some name-value arguments are required for specific SII calculations. For more information, see Speech Intelligibility Index Input Arguments.

    speechIntelligibilityIndex(___) without any output arguments plots a bar chart of equivalent speech and noise levels per band, overlaid with the BAF.

    Examples

    collapse all

    Create a vector of distances from 0.5–20 m at increments of 0.5 m.

    d = 0.5:0.5:20;

    Calculate the SII for each vocal effort and each distance. Use the default speech and noise profiles for 1/3 octave bands.

    sii = nan(4,numel(d));
    for ii = 1:numel(d)
        sii(1,ii) = speechIntelligibilityIndex( ...
            Method="1/3 octave band", ...
            VocalEffort="normal", ...
            Distance=d(ii));
        sii(2,ii) = speechIntelligibilityIndex( ...
            Method="1/3 octave band", ...
            VocalEffort="raised", ...
            Distance=d(ii));
        sii(3,ii) = speechIntelligibilityIndex( ...
            Method="1/3 octave band", ...
            VocalEffort="loud", ...
            Distance=d(ii));
        sii(4,ii) = speechIntelligibilityIndex( ...
            Method="1/3 octave band", ...
            VocalEffort="shout", ...
            Distance=d(ii));
    end

    Plot the SII for each vocal effort as a function of distance between speaker and listener.

    plot(d,sii)
    grid on
    title("Speech Intelligibility Index (SII)","Quiet Free-field, 1/3 octave band")
    xlabel('Distance (m)')
    ylabel('SII')
    legend('Normal','Raised','Loud','Shout',Location="SouthWest")
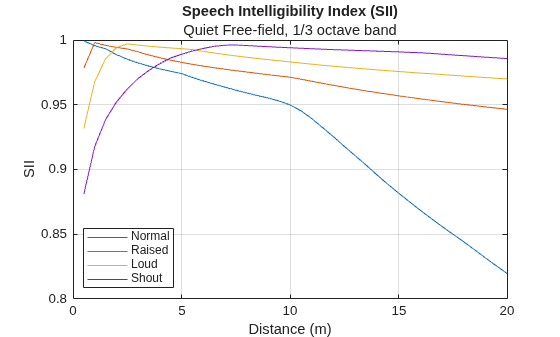
    Figure contains an axes object. The axes object with title Speech Intelligibility Index (SII), xlabel Distance (m), ylabel SII contains 4 objects of type line. These objects represent Normal, Raised, Loud, Shout.

    Investigate the effect of ear devices on the speech intelligibility index.

    Define octave-band center frequencies and typical attenuation in dB SPL for foam earplugs.

    freq = [250,500,1000,2000,4000,8000];
    attenuation = [41,45,44,36,43,47];

    Compare the SII for shouting speech levels in a loud environment with and without hearing protection.

    noiseSpectrum = [73 70 64 59 54 50];
    figure
    tiledlayout(2,1,TileSpacing="compact")
    nexttile
    speechIntelligibilityIndex(NoiseLevel=noiseSpectrum,...
        VocalEffort="shout")
    subtitle("Without Hearing Protection")
    nexttile
    speechIntelligibilityIndex(NoiseLevel=noiseSpectrum,...
        VocalEffort="shout",...
        InsertionGain=-attenuation)
    subtitle("With Hearing Protection")
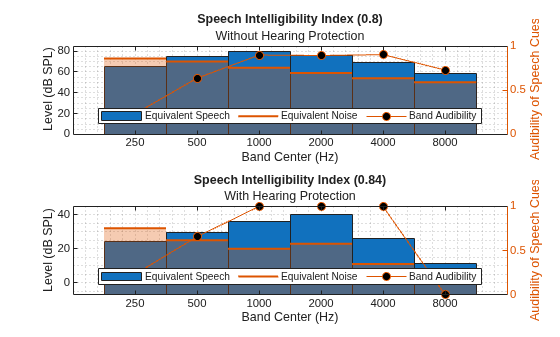
    Figure contains 2 axes objects. Axes object 1 with title Speech Intelligibility Index (0.8), xlabel Band Center (Hz), ylabel Audibility of Speech Cues contains an object of type line. These objects represent Equivalent Speech, Equivalent Noise, Band Audibility. Axes object 2 with title Speech Intelligibility Index (0.84), xlabel Band Center (Hz), ylabel Audibility of Speech Cues contains an object of type line. These objects represent Equivalent Speech, Equivalent Noise, Band Audibility.

    Define the typical hearing loss in dB HL for adults aged 60–69 and octave band gain in dB SPL for hearing aids.

    hearingLoss = [25,25,25,40,40,40];
    aidGain = [10,10,20,30,30,40];

    Compare the SII for normal speech and noise levels without and with hearing aids.

    figure
    tiledlayout(2,1,TileSpacing="compact")
    nexttile
    speechIntelligibilityIndex(HearingThreshold = hearingLoss)
    subtitle("Without Hearing Aids")
    nexttile
    speechIntelligibilityIndex(HearingThreshold = hearingLoss,...
        InsertionGain=aidGain)
    subtitle("With Hearing Aids")
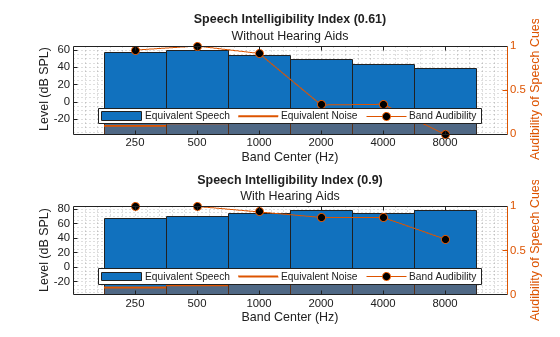
    Figure contains 2 axes objects. Axes object 1 with title Speech Intelligibility Index (0.61), xlabel Band Center (Hz), ylabel Audibility of Speech Cues contains an object of type line. These objects represent Equivalent Speech, Equivalent Noise, Band Audibility. Axes object 2 with title Speech Intelligibility Index (0.9), xlabel Band Center (Hz), ylabel Audibility of Speech Cues contains an object of type line. These objects represent Equivalent Speech, Equivalent Noise, Band Audibility.

    Calculate the SII from room impulse response simulations using the methods in clause 5.2 of the ANSI/ASA S3.5-1997 standard.

    Read a recording of a washing machine to simulate background noise in a space. Calculate the length of the recording in seconds.

    [noise,fs] = audioread("Engine-16-44p1-stereo-20sec.wav");
    noise = mean(noise,2); % convert to mono
    duration = numel(noise)/fs; % seconds

    Generate two room impulse responses of a shoebox room using acousticRoomResponse. The responses simulate measurements at the center of a listener's head. Generate the first response from the location of a speaker (1 m from the listener) and the second response from the location of the noise source (3 m from the listener).

    room = [4, 6, 6]; % meters
    headLoc = [2, 2.5, 1.75];
    speakerLoc = [2, 3.5, 1.75];
    noiseLoc = [2, 5.5, 1.75];
    irSpeaker = acousticRoomResponse(room,speakerLoc,headLoc,SampleRate=fs);
    irNoise = acousticRoomResponse(room,noiseLoc,headLoc,SampleRate=fs);

    Convolve the noise signal with the impulse response generated from the noise source location. Measure the equivalent continuous sound level (Leq) of the noise in the room using splMeter. This example treats the noise signal as if it was recorded using a calibrated microphone. For real measurements, use a signal recorded with a calibrated microphone or provide a calibration factor when creating the splMeter object.

    noiseInRoom = fftfilt(irNoise,noise);
    meter = splMeter(SampleRate=fs,...
        FrequencyWeighting="Z-weighting",...
        Bandwidth="1 octave",...
        FrequencyRange=[250,8000],...
        TimeInterval=duration);
    [~,noiseLeq] = meter(noiseInRoom);
    noiseLeq = noiseLeq(end,:); % use final reading

    Generate a speech spectrum excitation signal with the same duration as the audio recording using siiExcitation. To simulate a calibrated real-world excitation, set Normalize to false.

    [~,speechExcitation] = siiExcitation(fs, ...
        Method="octave band", ...
        Duration=duration, ...
        VocalEffort="shout", ...
        Normalize=false, ...
        OutputMode="merged");

    Convolve the speech excitation with the impulse response generated from the speaker location. Combine the noise and filtered speech signal and measure the combined speech and noise level (CSNSL).

    speechInRoom = fftfilt(irSpeaker,speechExcitation);
    speechAndNoise = speechInRoom+noiseInRoom;
    release(meter);
    [~,csnsl] = meter(speechAndNoise);
    csnsl = csnsl(end,:); % use final reading

    Calculate the speech intelligibility index using the simulated impulse response from the speaker location, CSNSL, and noise levels.

    speechIntelligibilityIndex(irSpeaker,fs, ...
        SpeechAndNoiseLevel=csnsl, ...
        NoiseLevel=noiseLeq)
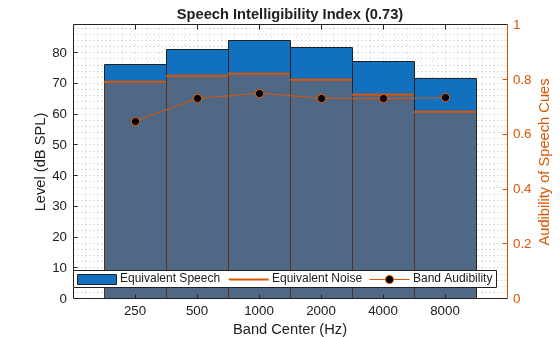
    Figure contains an axes object. The axes object with title Speech Intelligibility Index (0.73), xlabel Band Center (Hz), ylabel Audibility of Speech Cues contains 9 objects of type bar, line. These objects represent Equivalent Speech, Equivalent Noise, Band Audibility.

    Calculate the SII from recordings made at the eardrum using the methods in clause 5.3 of the ANSI/ASA S3.5-1997 standard.

    Use sofaread to load a Spatially Oriented Format for Acoustics (SOFA) file with generic head-related impulse responses (HRIRs). Choose the index that corresponds to a source directly in front of the listener.

    s = sofaread("ReferenceHRTF.sofa");
    mIndex = 7;
    fprintf("Azimuth: %0.f. Elevation: %0.f. Radius: %0.f.\n",s.SourcePosition(mIndex,:));
    Azimuth: 0. Elevation: 0. Radius: 4.
    

    Get the HRIR at the selected position for the left ear and the sample rate of the HRIR.

    fs = s.SamplingRate;
    hrir = squeeze(s.Numerator(mIndex,1,:));

    Generate the SII excitation signals with siiExcitation. To simulate a calibrated real-world excitation, set Normalize to false.

    duration = 16;
    [mtfExcitation,speechExcitation,levels] = siiExcitation(fs, ...
        Method="octave band", ...
        Duration=duration, ...
        Normalize=false, ...
        OutputMode="merged");

    Use pink noise to simulate a noise source. Convolve the speech excitation and noise signal with the HRIR. Combine the noise and filtered speech signal and measure the combined speech and noise level (CSNSL).

    noise = 0.25*pinknoise(duration*fs);
    speechAndNoise = fftfilt(hrir,speechExcitation+noise);

    Use splMeter to measure the CSNSL.

    meter = splMeter(SampleRate=fs,...
        FrequencyWeighting="Z-weighting",...
        Bandwidth="1 octave",...
        FrequencyRange=[250,8000],...
        TimeInterval=duration);
    
    [~,csnsl] = meter(speechAndNoise);
    csnsl = csnsl(end,:); % use final reading

    Convolve the MTF excitation and noise signals with the HRIR to generate the system response.

    mtfResponse = fftfilt(hrir,mtfExcitation+noise);

    Use the excitation and response signals to calculate the SII. Set SpeechMeasurementLocation and NoiseMeasurementLocation to "eardrum" to indicate that measurements were taken in-ear.

    speechIntelligibilityIndex(mtfResponse,mtfExcitation,fs, ...
        SpeechAndNoiseLevel=csnsl, ...
        Method="octave band",...
        SpeechMeasurementLocation="eardrum", ...
        NoiseMeasurementLocation="eardrum")
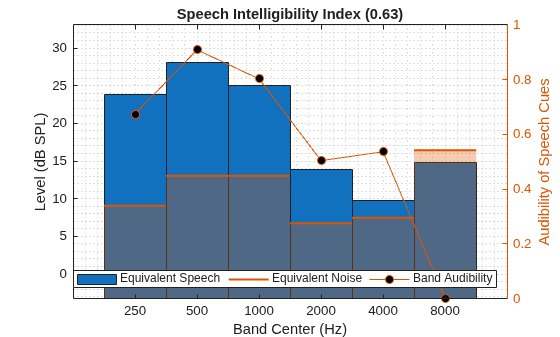
    Figure contains an axes object. The axes object with title Speech Intelligibility Index (0.63), xlabel Band Center (Hz), ylabel Audibility of Speech Cues contains 9 objects of type bar, line. These objects represent Equivalent Speech, Equivalent Noise, Band Audibility.

    Input Arguments

    collapse all

    Impulse response, specified as a numeric vector. When you specify ir, you must also specify fs. If background noise was present during the impulse response measurement, specify NoiseLevel to account for the noise contribution.

    The impulse response must be recorded under specific conditions for the SII to be standard-compliant in certain environments. For more information, see Speech Intelligibility Index Input Arguments and Measurement Locations.

    Data Types: single | double

    Received signals used to compute the modulation transfer function, specified as an N-by-9 matrix or an N-by-9-by-B array where N is the number of samples, 9 corresponds to the modulation frequencies (0.5, 1, 1.5, 2, 3, 4, 6, 8, and 16 Hz), and B is the number of frequency bands.

    When you specify processed, you must also specify reference and fs. The signals in reference can be generated using the siiExcitation function. The signals in processed correspond to the signals specified by reference after they are processed by the analyzed acoustic system. processed must have the same dimensions as reference.

    The processed signals must be recorded under specific conditions for the SII to be standard-compliant in certain environments. For more information, see Speech Intelligibility Index Input Arguments and Measurement Locations.

    Data Types: single | double

    Transmitted signals used to compute the modulation transfer function, specified as an N-by-9 matrix or an N-by-9-by-B array where N is the number of samples, 9 corresponds to the modulation frequencies (0.5, 1, 1.5, 2, 3, 4, 6, 8, and 16 Hz), and B is the number of frequency bands.

    Generate reference using the siiExcitation function. Specify OutputMode as "merged" to sum the outputs of each band into one signal for each modulation frequency, creating an N-by-9 matrix. Specify OutputMode as "full" to keep the output signals for each band separate, creating an N-by-9-by-B array.

    When you specify reference, you must also specify processed and fs. reference must have the same dimensions as processed.

    Data Types: single | double

    Sample rate in Hz, specified as a positive scalar. The minimum recommended sample rate is 16 kHz for the equally-contributing critical band method and 22.05 kHz for the critical band, one-third octave-band, and octave-band methods. You must specify fs when you specify either ir or processed and reference.

    Data Types: single | double

    Name-Value Arguments

    collapse all

    Specify optional pairs of arguments as Name1=Value1,...,NameN=ValueN, where Name is the argument name and Value is the corresponding value. Name-value arguments must appear after other arguments, but the order of the pairs does not matter.

    Example: sii = speechIntelligibilityIndex(ir,fs,Method="critical band")

    Filter bank procedure used in the SII computation, specified as one of the listed values. If you do not specify Method, the function infers the method from the size of band-dependent input arguments, or defaults to "1/3 octave band" if you do not provide band-dependent arguments.

    Method determines the number of frequency bands and the computational accuracy. The methods in descending order of accuracy and number of bands are:

    • Critical band (21 bands)

    • One-third octave band (18 bands)

    • Equally-contributing critical band (17 bands)

    • Octave band (6 bands)

    The standard recommends against using octave bands when the speech or noise levels vary greatly within one octave [1].

    Data Types: char | string

    Speech level, specified as "standard", "idealized", a numeric 1-by-B vector in dB SPL where B is the number of bands, or a numeric scalar representing the overall sound pressure level in dB OASPL. When you specify "standard", speechIntelligibilityIndex uses tabulated speech levels from the standard [1]. When you specify "idealized", the function uses a flat 35 dB spectrum up to 500 Hz, decreasing at 9 dB/octave above 500 Hz, adjusted for vocal effort (see VocalEffort).

    Specify a numeric vector to use custom per-band speech levels. If you specify a numeric scalar, the function interprets the level as the overall sound pressure level (OASPL). In this case, speechIntelligibilityIndex selects the standard speech spectrum adjusted for VocalEffort and adjusts band levels so that the OASPL is equal to SpeechLevel.

    speechIntelligibilityIndex errors if you specify SpeechLevel and any of ir, processed, reference, or fs. SpeechLevel is mutually exclusive with VocalEffort when specified as a vector and mutually exclusive with Distance when specified as a vector or numeric scalar.

    Data Types: char | string | single | double

    Noise level, specified as a numeric 1-by-B vector in dB SPL where B is the number of bands, or a numeric scalar in dB OASPL.

    When you do not specify input signals, the function uses NoiseLevel with SpeechLevel to compute the SII. When you specify ir, NoiseLevel serves as a correction factor for background noise present during measurement. When you specify processed and reference, speechIntelligibilityIndex uses NoiseLevel as a correction factor only when SpeechAndNoiseLevel is unspecified or a scalar value. The function errors if you specify NoiseLevel and also specify processed, reference, and SpeechAndNoiseLevel as a vector.

    If you do not specify NoiseLevel, speechIntelligibilityIndex uses a noise profile of –50 dB/Hz in each band. If you specify a numeric scalar, the function interprets the level as the OASPL and distributes the power evenly among all bands. This behavior might cause the calculated SII to be non-compliant with the standard. For standard compliance, specify a numeric vector.

    Data Types: single | double

    Combined speech and noise level, specified as a numeric 1-by-B vector in dB SPL where B is the number of bands, or a numeric scalar in dB OASPL. This argument represents the time-mean-square sum of the combined speech and noise levels.

    If you do not specify SpeechAndNoiseLevel, speechIntelligibilityIndex uses a standard speech spectrum profile with a noise profile of –50 dB/Hz in each band. If you specify a numeric scalar, the level represents the OASPL and might cause the calculated SII to be non-compliant with the standard. For standard compliance, specify a numeric vector.

    If you specify SpeechAndNoiseLevel, you must also specify ir or processed and reference.

    Data Types: single | double

    Distance between talker and listener in meters, specified as a positive scalar. speechIntelligibilityIndex uses Distance to derive the equivalent speech level from the standard speech spectrum using the inverse square law propagation model.

    speechIntelligibilityIndex errors if you specify Distance and any of ir, processed, reference, or fs. Distance is mutually exclusive with SpeechLevel specified as a numeric scalar or vector.

    Data Types: single | double

    Speech vocal effort, specified as one of the listed values. speechIntelligibilityIndex maps VocalEffort to speech levels from the standard [1] using the values shown in the table. The overall speech level determines the per-band speech level using Tables 1–4 from the standard, depending on the value of Method.

    VocalEffort valueSpeech Levels
    "normal"Speech levels corresponding to an overall speech level of 62.35 dB SPL
    "raised"Speech levels corresponding to an overall speech level of 68.34 dB SPL
    "loud"Speech levels corresponding to an overall speech level of 74.85 dB SPL
    "shout"Speech levels corresponding to an overall speech level of 82.30 dB SPL
    "raised-approximate"Speech levels corresponding to "normal" with each band increased by 7.8 dB
    "loud-approximate"Speech levels corresponding to "normal" with each band increased by 15.6 dB
    "shout-approximate"Speech levels corresponding to "normal" with each band increased by 23.4 dB

    speechIntelligibilityIndex errors if you specify VocalEffort and any of ir, processed, reference, or fs. VocalEffort is mutually exclusive with SpeechLevel specified as a vector.

    Data Types: char | string

    Device insertion gain in dB SPL, specified as a scalar or 1-by-B row vector, where B is the number of bands. Use insertion gain to model the effect of in-ear devices such as hearing aids or ear protectors. If you specify InsertionGain as a scalar, speechIntelligibilityIndex applies the value uniformly across all bands. The default value is 0 dB per band, indicating no insertion gain.

    Data Types: single | double

    Hearing threshold level in dB HL, specified as a nonnegative scalar or nonnegative 1-by-B row vector, where B is the number of bands. If you specify HearingThresholdLevel as a scalar, speechIntelligibilityIndex applies the value uniformly across all bands.

    Use HearingThresholdLevel to model the total hearing threshold elevation for all causes of hearing loss. The default value is 0 dB HL in all bands, corresponding to otologically normal hearing thresholds for listeners aged 18-30. Specify both HearingThresholdLevel and ConductiveHearingLossLevel to model the effects of conductive hearing loss. The value of HearingThresholdLevel must be greater than or equal to ConductiveHearingLossLevel in each band.

    Data Types: single | double

    Conductive hearing loss in dB HL, specified as a nonnegative scalar or nonnegative 1-by-B row vector, where B is the number of bands. If you specify ConductiveHearingLossLevel as a scalar, speechIntelligibilityIndex applies the value uniformly across all bands.

    Use conductive hearing loss levels to model additional attenuation from the outer or middle ear. When you do not specify ConductiveHearingLossLevel, speechIntelligibilityIndex assumes no conductive loss. The value of ConductiveHearingLossLevel must not exceed the HearingThresholdLevel in each band.

    Data Types: single | double

    Band importance function used to weight band audibility values in the SII calculation, specified as one of the listed string values or a nonnegative 1-by-B vector, where B is the number of bands.

    When you specify BandImportanceFunction as a string value, speechIntelligibilityIndex selects the corresponding importance function derived from Tables 1–4 and B.1–B.3 of the standard [1]. A numeric vector must contain at least one nonzero value. The function automatically normalizes custom numeric vectors so that the sum equals 1. The default value is the standard band importance function from Tables 1–4 of the standard, depending on the value of Method. For more information, see Band Importance Function and Band Audibility Function.

    Data Types: char | string | single | double

    Speech measurement location, specified as "free-field" or "eardrum". When you specify SpeechMeasurementLocation as "eardrum", speechIntelligibilityIndex applies the inverse free-field-to-eardrum transfer function to the speech levels. For more information, see Speech Intelligibility Index Input Arguments and Measurement Locations.

    If you specify SpeechMeasurementLocation as "eardrum", the following conditions apply:

    Data Types: char | string

    Noise measurement location, specified as "free-field" or "eardrum". When you specify NoiseMeasurementLocation as "eardrum", speechIntelligibilityIndex applies the inverse free-field-to-eardrum transfer function to the noise levels. For more information, see Speech Intelligibility Index Input Arguments and Measurement Locations.

    If you specify NoiseMeasurementLocation as "eardrum", the following conditions apply:

    Data Types: char | string

    Binaural listening indicator, specified as a logical scalar. When IsBinaural is true, HearingThresholdLevel is reduced by 1.7 dB to account for the binaural advantage in speech perception.

    Data Types: logical

    Output Arguments

    collapse all

    Speech intelligibility index, returned as a numeric scalar in the range [0, 1]. A value of 1.0 indicates that all speech cues are available to the listener, and a value of 0.0 indicates that no speech cues are available. The SII is the sum of band audibility values across frequency bands weighted by the band audibility function. For more information, see Speech Intelligibility Index Calculation and Band Importance Function and Band Audibility Function.

    Band audibility function (BAF), returned as a table with one column per frequency band. Each column is labeled by its band center frequency in Hz. Each value represents the proportion of usable speech energy in that band, ranging from 0 to 1. For more information, see Band Importance Function and Band Audibility Function.

    Modulation transfer function (MTF), returned as a table with one column per frequency band and one row per modulation frequency. Each column is labeled by its band center frequency in Hz. Each row is labeled by its modulation frequency (0.5, 1, 1.5, 2, 3, 4, 6, 8, and 16 Hz, respectively). Each value represents the modulation transfer index for the corresponding frequency band and modulation frequency.

    speechIntelligibilityIndex can only return mtf when you specify either ir or processed and reference. For more information, see Modulation Transfer Function.

    More About

    collapse all

    References

    [1] American National Standards Institute (ANSI). 1997. "Methods for calculation of the speech intelligibility index." ANSI/ASA S3.5-1997 (R2024). ANSI, approved June 6, 1997; reaffirmed September 5, 2024.

    [2] IEC 60268-16:2020. "Sound system equipment — Part 16: Objective rating of speech intelligibility by speech transmission index." International Electrotechnical Commission.

    Extended Capabilities

    expand all

    C/C++ Code Generation
    Generate C and C++ code using MATLAB® Coder™.

    Version History

    Introduced in R2026b