view
Plot state contributions when using balanced truncation of normalized coprime factors method
Since R2023b
Description
Use view to graphically analyze the model and select a model
order reduction criteria from a model order reduction task created using reducespec. For
NCFBalancedTruncation objects, you can visualize the state contributions of
the normalized coprime factorization of the full-order model as either Hankel singular values
or normalized state energies. For the full workflow, see Task-Based Model Order Reduction Workflow.
view( plots the default plot type for the
model order reduction algorithm of R)R. For balanced truncation
methods, this syntax plots Hankel singular values and associated error bounds.
view(___,Parent= creates
a plot in the specified parent graphics container, such as a parent)Figure or
TiledChartLayout. Use this syntax when you want to create a plot in a
specified open figure or when creating apps in App Designer. You can specify
the parent container after any of the input argument combinations in the previous
syntaxes.
view(___, specifies
additional options for customizing the appearance of Hankel singular value plots using one
or more name-value arguments. For example,
Name=Value)view(R,"sigma",YScale="Linear") plots the Hankel singular values
using a linear scale for the y axis.
view( returns help specific to the
model order specification object R,"-help")R. The returned help shows plot
types and syntaxes applicable to R.
Examples
This example shows how to obtain a reduced-order model using the balanced truncation of normalized coprime factors method.
Load a 30-state plant model G.
load ncfModel.mat G
size(G)
State-space model with 2 outputs, 3 inputs, and 30 states.
Create a model order reduction task.
R = reducespec(G,"ncf");To help you select a suitable target reduction order, examine the plot of Hankel singular values and approximation errors.
Create the plot.
view(R)
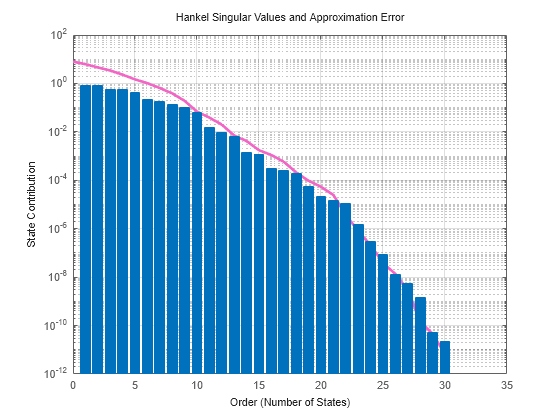
The function generates a Hankel singular value plot, which shows the relative energy contributions of each state in the coprime factorization of G, arranged in decreasing order by energy. The plot also shows the upper bound on the error between the original and reduced-order models that you obtain by truncating the states at that point. Examine this plot to choose the target order. For instance, for a maximum error of 0.01, you can reduce the model to 13th order.
Examine the singular values of G and of the difference between G and Gred.
Gred = getrom(R,MaxError=0.01);
sigma(G,G-Gred)
legend("G","G-Gred")
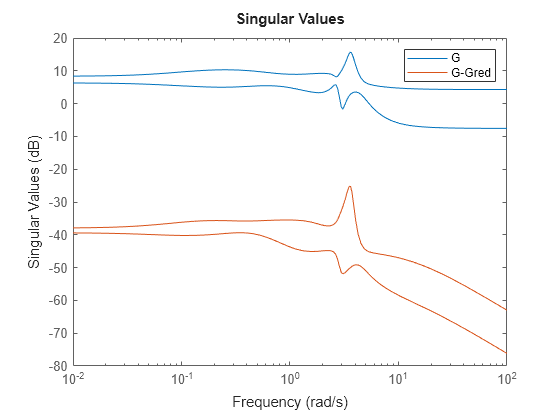
The difference is small across all frequencies, showing that the reduced-order model is a good approximation of the full-order model.
This example shows how to customize the state contribution plots obtained using the view function in the model order reduction workflow.
For this example, create a model order reduction specification for an LTI model using the balanced truncation of normalized coprime factors method.
Generate a random discrete-time state-space model with 40 states.
rng(0)
sys = drss(40);
Create a specification object.
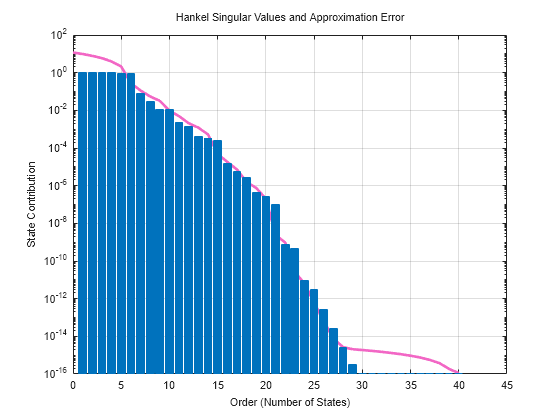
R = reducespec(sys,"ncf");Visualize the Hankel singular values.
view(R)
To customize the plots for balanced truncation methods, you can use hsvoptions properties as input arguments.
h = view(R,"sigma",YScale="linear");
You can further customize this plot by modifying the properties of h.
h.AxesStyle.GridVisible = "off";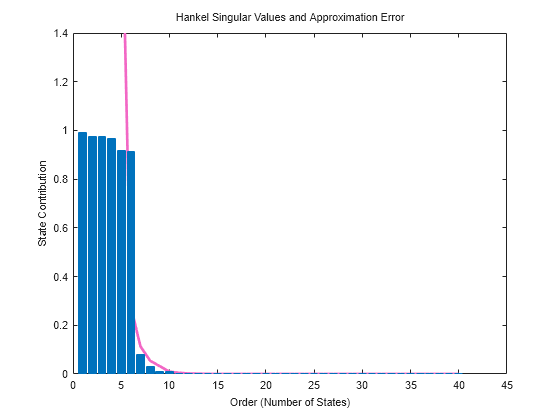
Input Arguments
Output Arguments
Version History
Introduced in R2023bSee Also
Functions
reducespec|process|getrom (ncf)|view (balanced)|getrom (balanced)|view (modal)|getrom (modal)