拟合指数模型
关于指数模型
工具箱提供一个单项指数模型和一个双项指数模型,如以下公式所示
当一个量的变化率与该量的初始量成正比时,通常使用指数。如果与 b 和/或 d 相关联的系数为负值,则 y 表示指数衰减。如果系数为正值,y 表示指数增长。
例如,核素的单一放射性衰变模式由单项指数描述。a 解释为原子核的初始数量,b 是衰变常量,x 是时间,y 是经过特定时间后剩余的原子核数量。如果存在两种衰减模式,则必须使用双项指数模型。对于第二种衰减模式,您需要在模型中添加另一个指数项。
指数增长的示例包括无法治愈的传染病,以及其生长不受捕食、环境因素等抑制的生物种群等。
以交互方式拟合指数模型
通过在 MATLAB® 命令行中输入
curveFitter打开曲线拟合器。或者,在 App 选项卡上的数学、统计和优化组中,点击曲线拟合器。在曲线拟合器中,选择曲线数据。在曲线拟合器选项卡的数据部分中,点击选择数据。在选择拟合数据对话框中,选择 X 数据和 Y 数据,或仅选择 Y 数据(相对于索引绘图)。
点击拟合类型部分中的箭头以打开库,然后点击回归模型组中的指数。
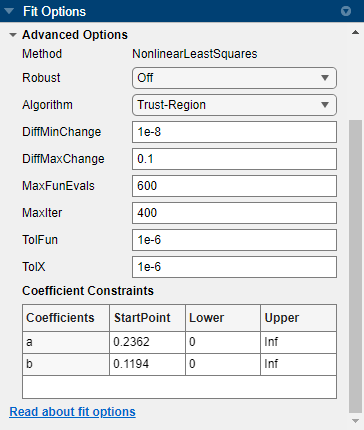
此处显示单项指数拟合的拟合选项窗格。

您可以在拟合选项窗格中指定以下选项:
选择一个或两个项以拟合
exp1或exp2。在结果窗格中查看模型项、系数值和拟合优度统计量。(可选)在高级选项部分,指定系数起始值和适用您的数据的约束边界,或更改算法设置。此处显示的系数起始值和约束适用于
census数据。该 App 根据数据集计算指数拟合的优化起点。您可以覆盖起点,并在拟合选项窗格中指定您自己的值。有关指定适合数据的起始值的示例,请参阅Gaussian Fitting with an Exponential Background。
有关设置的详细信息,请参阅系数约束:指定边界和优化起点。
使用拟合函数拟合指数模型
此示例说明如何使用 fit 函数对数据进行指数模型拟合。
指数库模型是 fit 和 fittype 函数的输入参量。指定模型类型 'exp1' 或 'exp2'。
单项指数模型拟合
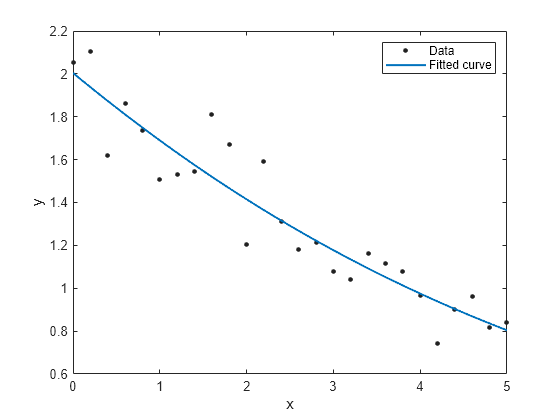
生成具有指数趋势的数据,然后使用单项指数对数据进行拟合。绘制拟合图和数据图。
x = (0:0.2:5)';
y = 2*exp(-0.2*x) + 0.1*randn(size(x));
f = fit(x,y,'exp1')
f =
General model Exp1:
f(x) = a*exp(b*x)
Coefficients (with 95% confidence bounds):
a = 2.021 (1.89, 2.151)
b = -0.1812 (-0.2104, -0.152)
plot(f,x,y)

双项指数模型拟合
f2 = fit(x,y,'exp2')f2 =
General model Exp2:
f2(x) = a*exp(b*x) + c*exp(d*x)
Coefficients (with 95% confidence bounds):
a = 384.8 (-4.78e+09, 4.78e+09)
b = -0.2572 (-2939, 2938)
c = -382.8 (-4.78e+09, 4.78e+09)
d = -0.2577 (-2957, 2957)
plot(f2,x,y)
设置起点
工具箱基于当前数据集计算优化的指数拟合起点。您可以覆盖起点,并指定您自己的值。
使用 coeffnames 函数找出第一个模型 (f) 中系数项的顺序。
coeffnames(f)
ans = 2×1 cell
{'a'}
{'b'}
如果指定起点,请选择适合您的数据的值。出于示例目的,为系数 a 和 b 设置任意起点。
f = fit(x,y,'exp1','StartPoint',[1,2])
f =
     General model Exp1:
     f(x) = a*exp(b*x)
     Coefficients (with 95% confidence bounds):
       a =       2.021  (1.89, 2.151)
       b =     -0.1812  (-0.2104, -0.152)
plot(f,x,y)

检查指数拟合选项
如果要修改拟合选项(如适用于数据的系数起始值和约束边界)或更改算法设置,请检查拟合选项。有关这些选项的详细信息,请参阅 fitoptions 参考页上 NonlinearLeastSquares 的属性表。
fitoptions('exp1')ans =
nlsqoptions with properties:
StartPoint: []
Algorithm: 'Trust-Region'
DiffMinChange: 1.0000e-08
DiffMaxChange: 0.1000
Display: 'Notify'
MaxFunEvals: 600
MaxIter: 400
TolFun: 1.0000e-06
TolX: 1.0000e-06
Lower: []
Upper: []
ConstraintPoints: []
TolCon: 1.0000e-06
Robust: 'Off'
Normalize: 'off'
Exclude: []
Weights: []
Method: 'NonlinearLeastSquares'
另请参阅
App
函数
fit|fittype|fitoptions