fittype
曲线和曲面拟合的拟合类型
语法
说明
aFittype = fittype(libraryModelName)aFittype 指定的模型创建 fittype 对象 libraryModelName。
aFittype = fittype(expression)
aFittype = fittype(expression,Name,Value)Name,Value 对组参量指定其他选项。
aFittype = fittype(linearModelTerms)linearModelTerms 中的表达式指定的项为自定义线性模型创建拟合类型。
aFittype = fittype(linearModelTerms,Name,Value)Name,Value 对组参量指定其他选项。
aFittype = fittype(anonymousFunction)anonymousFunction 指定的模型创建拟合类型。
aFittype = fittype(anonymousFunction,Name,Value)Name,Value 对组参量指定其他选项。
示例
通过指定库模型名称来构造拟合类型。
为三次多项式库模型构造 fittype 对象。
f = fittype('poly3')f =
Linear model Poly3:
f(p1,p2,p3,p4,x) = p1*x^3 + p2*x^2 + p3*x + p4
为库模型 rat33 构造拟合类型(分子和分母均为三次的有理模型)。
f = fittype('rat33')f =
General model Rat33:
f(p1,p2,p3,p4,q1,q2,q3,x) = (p1*x^3 + p2*x^2 + p3*x + p4) /
(x^3 + q1*x^2 + q2*x + q3)
有关库模型名称的列表,请参阅 libraryModelName。
为自定义非线性模型创建拟合类型,将 n 指定为问题相关参数,将 u 指定为自变量。
g = fittype("n*u^a",...
            problem="n",...
            independent="u")
g =
     General model:
     g(a,n,u) = n*u^a
为某些数据的对数拟合创建拟合类型,使用拟合类型创建拟合,然后绘制拟合图。
x = linspace(1,100);
y = 7*log(x+5);
myfittype = fittype("a*log(x+b)",...
    dependent="y",independent="x",...
    coefficients=["a" "b"])
myfittype =
     General model:
     myfittype(a,b,x) = a*log(x+b)
myfit = fit(x',y',myfittype)
Warning: Start point not provided, choosing random start point.
myfit =
     General model:
     myfit(x) = a*log(x+b)
     Coefficients (with 95% confidence bounds):
       a =           7  (7, 7)
       b =           5  (5, 5)
plot(myfit,x,y)
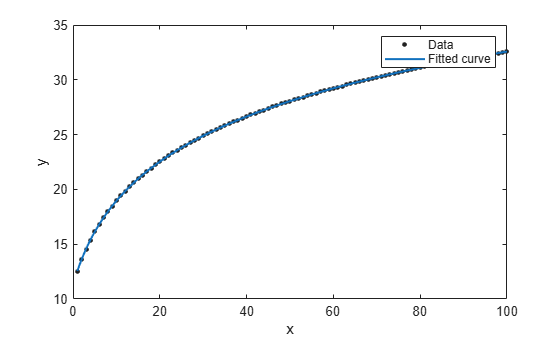
绘图显示拟合与数据吻合。
要使用线性拟合算法,请指定一个由项组成的元胞数组。
确定您需要输入到 fittype 的线性模型项:a*x + b*sin(x) + c。模型的 a、b 和 c 是线性的。它有三个项 x、sin(x) 和 1(因为 c=c*1)。要指定此模型,您可以使用以下由项组成的元胞数组:LinearModelTerms = {'x','sin(x)','1'}。
使用线性模型项的元胞数组作为 fittype 的输入。
ft = fittype({'x','sin(x)','1'})ft =
Linear model:
ft(a,b,c,x) = a*x + b*sin(x) + c
为 a*cos(x) + b 创建线性模型拟合类型。
ft2 = fittype({'cos(x)','1'})ft2 =
Linear model:
ft2(a,b,x) = a*cos(x) + b
再次创建拟合类型并指定系数名称。
ft3 = fittype({'cos(x)','1'},'coefficients',{'a1','a2'})ft3 =
Linear model:
ft3(a1,a2,x) = a1*cos(x) + a2
在文件中定义一个函数,并使用它来创建拟合类型和进行曲线拟合。
在 MATLAB ® 文件中定义一个函数。
type piecewiseLine.mfunction y = piecewiseLine(x,a,b,c,k)
% PIECEWISELINE A line made of two pieces
y = zeros(size(x));
% This example includes a for-loop and if statement
% purely for example purposes.
for i = 1:length(x)
if x(i) < k
y(i) = a + b.*x(i);
else
y(i) = a + b*k + c.*(x(i)-k);
end
end
end
保存该文件。
定义一些数据并创建一个指定函数 piecewiseLine 的拟合类型。
x = [0.81;0.91;0.13;0.91;0.63;0.098;0.28;0.55;...
    0.96;0.96;0.16;0.97;0.96];
y = [0.17;0.12;0.16;0.0035;0.37;0.082;0.34;0.56;...
    0.15;-0.046;0.17;-0.091;-0.071];
ft = fittype('piecewiseLine( x, a, b, c, k )')
ft =
     General model:
     ft(a,b,c,k,x) = piecewiseLine( x, a, b, c, k )
ft 的输入是按字母顺序排列的系数,后跟自变量。请参阅匿名函数的输入顺序了解更多信息。
如果要控制系数的顺序,则可以使用匿名函数输入。例如,要更改系数 a 和 b 的顺序:
ft = fittype(@(b,a,c,k,x) piecewiseLine(x,a,b,c,k))
您必须最后指定自变量 x。
使用拟合类型 ft 创建拟合并绘制结果。
f = fit(x, y, ft, 'StartPoint', [1, 0, 1, 0.5]);
plot(f, x, y)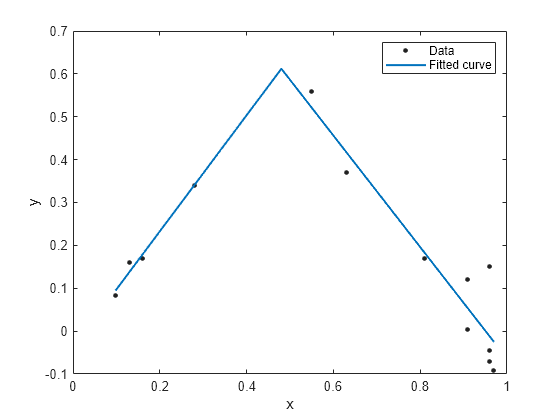
使用匿名函数创建一个拟合类型。
g = fittype( @(a, b, c, x) a*x.^2+b*x+c )
使用匿名函数创建一个拟合类型,并指定自变参数和因变参数。
g = fittype( @(a, b, c, d, x, y) a*x.^2+b*x+c*exp(...
 -(y-d).^2 ), 'independent', {'x', 'y'},...
     'dependent', 'z' );
使用匿名函数为曲面创建一个拟合类型,并指定自变参数和因变参数,以及问题参数(稍后您在调用 fit 时将指定它)。
g = fittype( @(a,b,c,d,x,y) a*x.^2+b*x+c*exp( -(y-d).^2 ), ...
        'problem', {'c','d'}, 'independent', {'x', 'y'}, ...
        'dependent', 'z' );
使用匿名函数将工作区数据传入 fittype 和 fit 函数。
创建一条 S 形曲线并对其绘图。在后面的步骤中,您将拉伸并移动此曲线以对某些数据进行拟合。
% Breakpoints.
xs = (0:0.1:1).';
% Height of curve at breakpoints.
ys = [0; 0; 0.04; 0.1; 0.2; 0.5; 0.8; 0.9; 0.96; 1; 1];
% Plot S-shaped curve.
xi = linspace( 0, 1, 241 );
plot( xi, interp1( xs, ys, xi, 'pchip' ), 'LineWidth', 2 )
hold on
plot( xs, ys, 'o', 'MarkerFaceColor', 'r' )
hold off
title S-curve
使用匿名函数创建一个拟合类型,从工作区中获取曲线断点的值 (xs) 和在断点处曲线的高度 (ys)。系数为 b(底)和 h(高)。
ft = fittype( @(b, h, x) interp1( xs, b+h*ys, x, 'pchip' ) )绘制 fittype,指定底 b=1.1 和高 h=-0.8 的示例系数。
plot( xi, ft( 1.1, -0.8, xi ), 'LineWidth', 2 )
title 'Fittype with b=1.1 and h=-0.8'
加载一些数据并使用通过工作区值创建的拟合类型 ft 对数据进行拟合。
% Load some data
xdata = [0.012;0.054;0.13;0.16;0.31;0.34;0.47;0.53;0.53;...
   0.57;0.78;0.79;0.93];
ydata = [0.78;0.87;1;1.1;0.96;0.88;0.56;0.5;0.5;0.5;0.63;...
   0.62;0.39];
% Fit the curve to the data
f = fit( xdata, ydata, ft, 'Start', [0, 1] )
% Plot fit
plot( f, xdata, ydata )
title 'Fitted S-curve'
此示例说明使用带问题参数的匿名函数和带工作区变量值的匿名函数之间的差异。
加载数据,使用带问题参数的匿名函数为曲线创建拟合类型,并调用 fit 指定问题参数。
% Load some data.
xdata = [0.098;0.13;0.16;0.28;0.55;0.63;0.81;0.91;0.91;...
    0.96;0.96;0.96;0.97];
ydata = [0.52;0.53;0.53;0.48;0.33;0.36;0.39;0.28;0.28;...
    0.21;0.21;0.21;0.2];

% Create a fittype that has a problem parameter.
g = fittype( @(a,b,c,x) a*x.^2+b*x+c, 'problem', 'c' )

% Examine coefficients. Observe c is not a coefficient.
coeffnames( g )

% Examine arguments. Observe that c is an argument.
argnames( g )

% Call fit and specify the value of c.
f1 = fit( xdata, ydata, g, 'problem', 0, 'StartPoint', [1, 2] )

% Note: Specify start points in the calls to fit to
% avoid warning messages about random start points
% and to ensure repeatability of results.

% Call fit again and specify a different value of c,
% to get a new fit.
f2 = fit( xdata, ydata, g, 'problem', 1, 'start', [1, 2] )

% Plot results. Observe the specified c constants
% do not make a good fit.
plot( f1, xdata, ydata )
hold on
plot( f2, 'b' )
hold off
修改前面的示例,使用工作区变量值而不是使用问题参数来创建相同的拟合。使用相同的数据,使用带工作区变量 c 的值的匿名函数为曲线创建拟合类型:
% Remove c from the argument list.
try
    g = fittype( @(a,b,x) a*x.^2+b*x+c )
catch e
    disp( e.message )
end
% Observe error because now c is undefined.
% Define c and create fittype:
c = 0;
g1 = fittype( @(a,b,x) a*x.^2+b*x+c )

% Call fit (now no need to specify problem parameter).
f1 = fit( xdata, ydata, g1, 'StartPoint', [1, 2] )
% Note that this f1 is the same as the f1 above.
% To change the value of c, recreate the fittype.
c = 1;
g2 = fittype( @(a,b,x) a*x.^2+b*x+c ) % uses c = 1
f2 = fit( xdata, ydata, g2, 'StartPoint', [1, 2] )
% Note that this f2 is the same as the f2 above.
% Plot results
plot( f1, xdata, ydata )
hold on
plot( f2, 'b' )
hold off
输入参数
名称-值参数
输出参量
详细信息
算法
如果拟合类型表达式输入是字符向量、字符串标量或匿名函数,则工具箱使用非线性拟合算法对数据进行模型拟合。
如果拟合类型表达式输入是元胞数组或字符串数组,则工具箱使用线性拟合算法对数据进行模型拟合。