ploterrhist
(To be removed) Plot error histogram
ploterrhist will be removed in a future release. For more information,
see Transition Legacy Neural Network Code to dlnetwork Workflows.
For advice on updating your code, see Version History.
Description
ploterrhist( plots a histogram of error
values e)e.
ploterrhist(e1,'name1',e2,'name2',...) takes any number of errors
and names and plots each pair.
ploterrhist(..., takes an optional
property name-value pair which defines the number of bins to use in the histogram plot. The
default is 20.'bins',bins)
Examples
This example shows how to plot the histogram of error values of a trained feedforward network.
Create a feedforward network and train it using the data from the simple fit data set. Then plot the histogram of error values.
[x,t] = simplefit_dataset;
net = feedforwardnet(20);
net = train(net,x,t);
y = net(x);
e = t - y;
ploterrhist(e,'bins',30)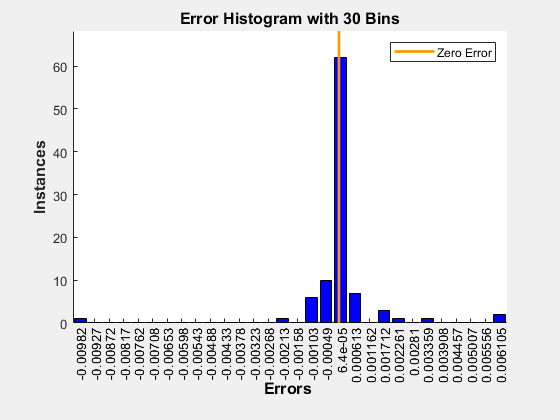
Input Arguments
Version History
Introduced in R2010bSee Also
Time Series Modeler | fitrnet (Statistics and Machine Learning Toolbox) | trainnet | trainingOptions | dlnetwork | histogram