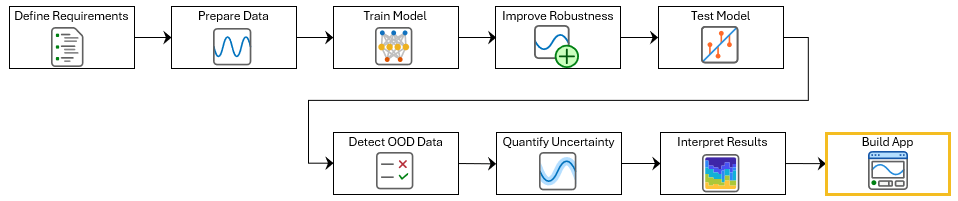
Build Deep Learning ECG Signal Classification App Using App Designer
This example shows how to use App Designer to create an app for ECG signal classification. This example is step nine in a series of examples that take you through an ECG signal classification workflow. This example follows the Investigate ECG Signal Classifications Using Grad-CAM example. For more information about the full workflow, see ECG Signal Classification Using Deep Learning.
To run this example, open ECG Signal Classification Using Deep Learning and navigate to scripts\S9_BuildApp. Alternatively, if you already have MATLAB open, then run
openExample("deeplearning_shared/ECGSignalClassificationUsingDeepLearningExample") This project contains all of the steps for this workflow. You can run the scripts in order or run each one independently.
In this example, you build an app for ECG signal classification and deploy it as a standalone desktop application for users without MATLAB®. The app allows users to:
Import an ECG signal from a file
Use a trained neural network to classify the signal
Check if the signal is in-distribution
Visualize a Grad-CAM explanation of the classification
While this example uses a local file, you can apply the same workflow to streamed data from IoT platforms such as ThingSpeak™ in real-world scenarios.
Use Prebuilt App
This example shows how to build an app from scratch. To view a prebuilt version of the app, you can either open the app in App Designer by using the ecgClassifier supporting file, or run the app by calling ecgClassifier in the Command Window. To use the app, click the Import button and select ecgSignal.txt.
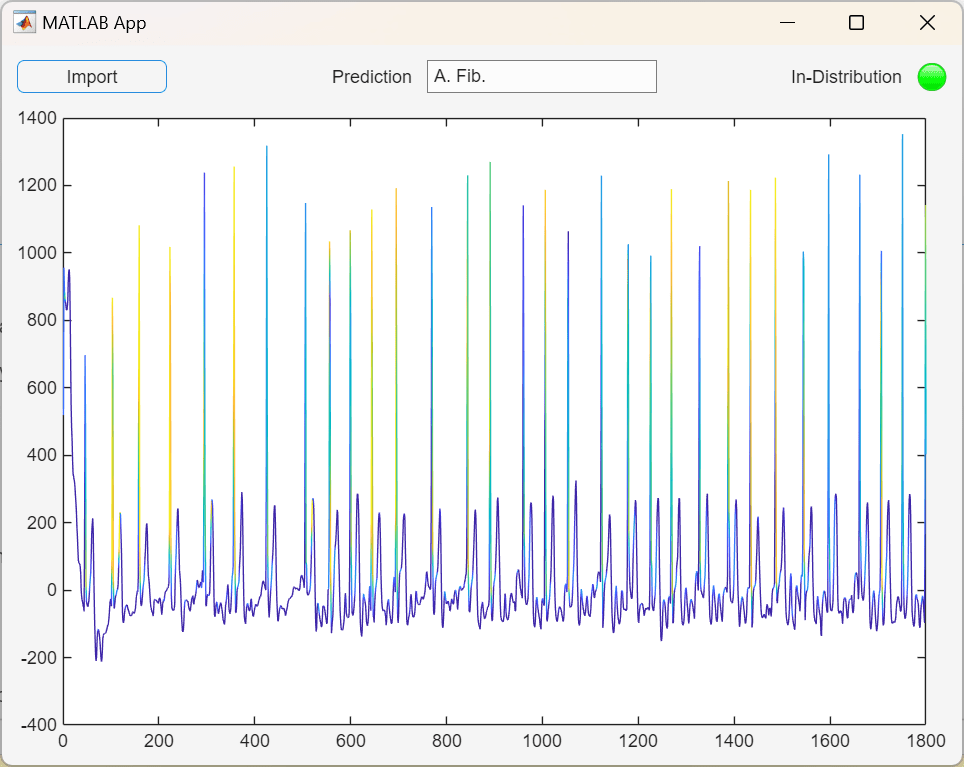
The app displays:
A visualization of the signal.
The network prediction for the signal: "A. Fib." (atrial fibrillation) or "Normal".
An indicator of whether the signal is in-distribution or not. Data that is sufficiently similar to the training data is referred to as in-distribution data. Out-of-distribution data refers to data that differs significantly from the data used to train the classifier and can lead to unreliable predictions. For more information, see Out-of-Distribution Detection for ECG Signal Classification.
A Grad-CAM colormap of the parts of the signal that are most important to the prediction decision of the classifier. Yellow represents the greatest importance, while blue represents the least. For more information, see Investigate ECG Signal Classifications Using Grad-CAM.
The next steps show how to create this app.
Build App
App Designer is an interactive development environment in MATLAB for creating custom apps with graphical user interfaces. You can use App Designer to create, edit, and share apps.
Open App Designer. In the MATLAB toolstrip, select Home > New > App.
App Designer has two views for creating an app:
Design View — Create UI components and interactively lay out your app.
Code View — Program the behavior of your app.
You can switch between the two views using the toggle buttons in the upper-right corner of App Designer.
Add Controls
In App Designer, switch to Design View. To build the app, follow these steps:
Drag a Button component from the Component Library onto the canvas. Double click the button and change the label to "Import".
Drag an Edit Field (Text) onto the canvas and change the label to "Prediction".
Drag a Lamp onto the canvas and change the label to "In-Distribution".
Drag an Axes onto the canvas. You can change the title and axes labels by setting properties in the Component Browser.
In the Toolstrip, click Save As. Name your app
imageClassifier.
Load Distribution Discriminator into App
To perform inference and out-of-distribution detection, the app needs access to the distribution discriminator. A distribution discriminator is an object for classifying a signal as in- or out-of-distribution. For more information about how to create a distribution discriminator, see Out-of-Distribution Detection for ECG Signal Classification. In this example, load a discriminator from a file into a property of the app.
In App Designer, switch to Code View.
![]()
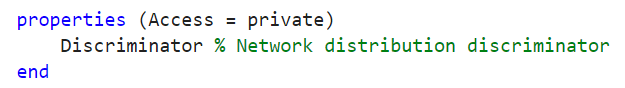
In the Toolstrip, select Property > Private Property to create a new private property. Rename the property Discriminator.
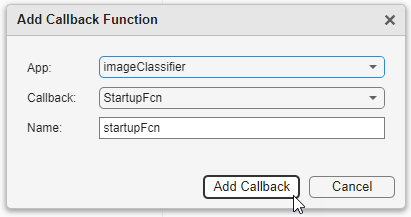
To add a new startup function, in the App Designer toolstrip, click Callback. Select the Component as the name of your app, imageClassifier. To use the default startup function, click Add Callback. The Add Callback Function dialog box opens.
The startup function callback runs when a user first opens the app. Use the startupFcn callback to load your network distribution discriminator into the app.
Replace the contents of the startupFcn function with the following code. With the new code, the startupFcn function loads the network distribution discriminator into the Discriminator property. The load function loads the variables in a structure array where each variable is in a field. You can access data in a field by using dot notation of the form structName.fieldName.
function startupFcn(app)
    savedData = load("DistributionDiscriminator.mat");
    app.Discriminator = savedData.discriminator;
end
Define Import Code
The next step is to define the code behind each of the controls. Click the Code View button above the canvas to edit your app. Program your app behavior by using callback functions. A callback function is a function that executes when the app user performs a specific interaction, such as clicking on the Import button.
Right-click app.ImportButton in the Component Browser and select Callbacks > Add ButtonPushedFcn. Replace the contents of your callback function with the following code:
function ImportButtonBushed(app, event)
    % Prompt user to select an ECG signal file
    [file, path] = uigetfile('*.txt');
    if isequal(file, 0)
        % User cancelled the file selection
        return
    end

    % Load the ECG signal from the selected file
    signalPath = fullfile(path, file);
    ecgSignal = readmatrix(signalPath);
    ecgSignal = dlarray(ecgSignal, "CTB");

    % Predict the class of the ECG signal
    scores = predict(app.Discriminator.Network, ecgSignal);
    predictedClass = scores2label(scores, ["A. Fib.", "Normal"]);
    app.PredictionEditField.Value = string(predictedClass);

    % Determine if the signal is in-distribution
    inDistribution = isInNetworkDistribution(app.Discriminator, ecgSignal);
    if inDistribution
        app.InDistributionLamp.Color = "green";
    else
        app.InDistributionLamp.Color = "red";
    end

    % Generate and plot the Grad-CAM explanation
    plotGradCAMExplanation(app, ecgSignal, predictedClass);
end
In the next section, define the plotGradCAMExplanation helper function that this callback uses.
Define Helper Function
Helper functions are MATLAB® functions that you define to use in your app. After you define a helper function, you can call it at different places in your app code. For example, you can call a helper function to update a plot after an app user changes a number on a slider or selects an item in a drop-down list. Creating a helper function allows you to single-source common commands and avoid maintaining redundant code.
Create a helper function in App Designer from Code View. In the Editor tab of the toolstrip, click Function > Private Function.
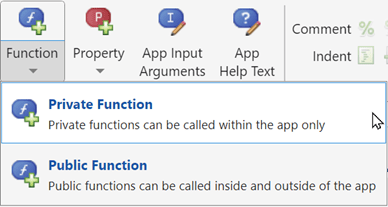
Name the function plotGradCAMExplanation and replace its contents with the following code:
function plotGradCAMExplanation(app, ecgSignal, predictedClass)
    % Compute GradCAM importance
    importance = gradCAM(app.Discriminator.Network, ecgSignal, predictedClass);

    % Prepare data for plotting
    ecgSignal = squeeze(extractdata(ecgSignal));
    numPoints = numel(ecgSignal);
    x = 1:numPoints + 1;
    y = [ecgSignal(:); NaN];
    c = [importance(:); NaN];

    % Plot the explanation
    patch(app.UIAxes, x, y, c, EdgeColor="interp");
    colorbar;
end
Use App
To save and run the app, click Run. Alternatively, call the name of the app in the Command Window. To use the app, click the Import button and select ecgSignal.txt.
Create a Standalone Desktop Application
Creating a standalone desktop application lets you share an app with users who do not have MATLAB on their systems. However, you must have MATLAB Compiler installed on your system to create the standalone application. Your users must have MATLAB Runtime on their systems to run the app.
Once you have MATLAB Compiler on your system, you can open the Application Compiler from within App Designer by clicking Share in the Designer tab and selecting Standalone Desktop App.