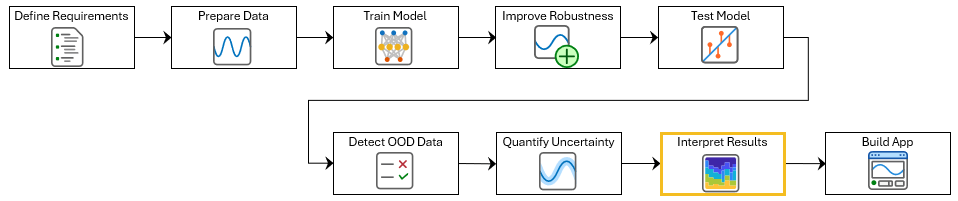
Investigate ECG Signal Classifications Using Grad-CAM
This example shows how to use the gradient-weighted class activation mapping (Grad-CAM) technique to understand the classification decisions of a deep neural network for ECG signal classification. This example is step eight in a series of examples that take you through an ECG signal classification workflow. This example follows the Uncertainty Quantification for ECG Signal Classification example. For more information about the full workflow, see ECG Signal Classification Using Deep Learning.
To run this example, open ECG Signal Classification Using Deep Learning and navigate to scripts\S8_ExplainPredictions. Alternatively, if you already have MATLAB open, then run
openExample("deeplearning_shared/ECGSignalClassificationUsingDeepLearningExample")This project contains all of the steps for this workflow. You can run the scripts in order or run each one independently.
Grad-CAM uses the gradient of the classification score with respect to the convolutional features determined by the network to understand which parts of the data are most important for classification. For time-series data, Grad-CAM computes the most important time steps for the classification decision of the network. For example, this image shows an example of an atrial fibrillation signal. The color of the signal represents the parts of the signal that the Grad-CAM explanation determines the network uses for classification.
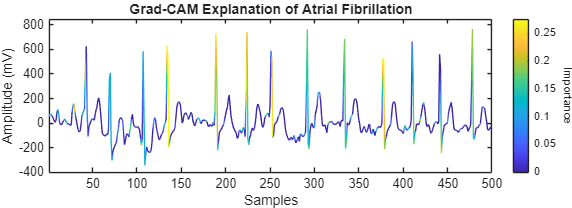
The ECG signal features highlighted by Grad-CAM represent the specific patterns or intervals that the neural network relies upon to make its prediction. However, it is important to note that these features are not necessarily the same as those a physician would use when diagnosing atrial fibrillation. While a clinician might focus on established criteria such as irregular R-R intervals or the absence of P-waves, the network might identify subtle, data-driven cues that are not part of traditional medical knowledge.
In this example, you will investigate ECG signal classifications using Grad-CAM.
Load the test data. If you have run the previous step, Prepare Data for ECG Signal Classification, then the example uses the data that you prepared in that step. Otherwise, the example prepares the data as shown in Prepare Data for ECG Signal Classification.
if ~exist("XTest","var") || ~exist("TTest","var")
    [~,~,~,~,XTest,TTest] = prepareECGData;
end
Load a pretrained network. If you have run the previous training step, Improve Adversarial Robustness of Deep Learning Network for ECG Signal Classification, then the example uses your trained network. Otherwise, load a pretrained network. The network has been trained using the steps shown in Improve Adversarial Robustness of Deep Learning Network for ECG Signal Classification.
if ~exist("netRobust","var")
    load("adversariallyTrainedECGNetwork.mat");
end
Use Grad-CAM to Interpret Classification Results
Use Grad-CAM to visualize the parts of the sequence that the network uses to make its classification decisions.
Find a subset of sequences that the network correctly classifies as Atrial Fibrillation ("A").
numToPlot = 2;

scores = minibatchpredict(netRobust,XTest,InputDataFormats="CTB");
YTest = scores2label(scores,categories(TTest));

isTruePositive = (YTest == "A") & (TTest == "A");
idxTruePositive = find(isTruePositive,numToPlot);
For each observation, compute and visualize the Grad-CAM importance map. To compute the map, use the gradCAM function. Display a colormap representing the Grad-CAM importance by using the plotWithColorGradient helper function, found at the end of this example.
figure
tiledlayout("flow")

for ii = 1:numToPlot
    currentSignal = XTest{idxTruePositive(ii)};
    currentLabel = YTest(idxTruePositive(ii));

    importance = gradCAM(netRobust, currentSignal, currentLabel);

nexttile
    plotWithColorGradient(currentSignal(1:500), importance(1:500))
end
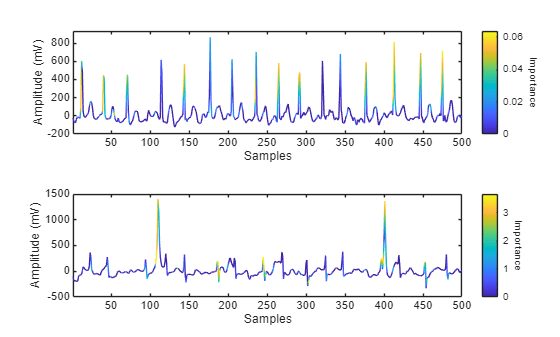
By analyzing Grad-CAM importance maps across multiple correctly classified Atrial Fibrillation signals, you can begin to understand the patterns that the network relies on to identify atrial fibrillation. These patterns might differ from traditional clinical features, but they offer insight into the decision-making process of the model. In clinical applications, this interpretability can help build trust in automated ECG classification systems and support safer decision-making.
Use Grad-CAM to Investigate Misclassifications
You can also use Grad-CAM to investigate misclassified sequences.
Find a subset of sequences that the network incorrectly classifies as Atrial Fibrillation.
isFalseNegative = (YTest ~= "A") & (TTest == "A");
idxFalseNegative = find(isFalseNegative,numToPlot);
For each observation, compute and visualize the Grad-CAM map.
figure
tiledlayout("flow")

for ii = 1:numToPlot
    currentSignal = XTest{idxFalseNegative(ii)};
    currentLabel = YTest(idxFalseNegative(ii));

    importance = gradCAM(netRobust,currentSignal,currentLabel);

nexttile
    plotWithColorGradient(currentSignal(1:500),importance(1:500))
end
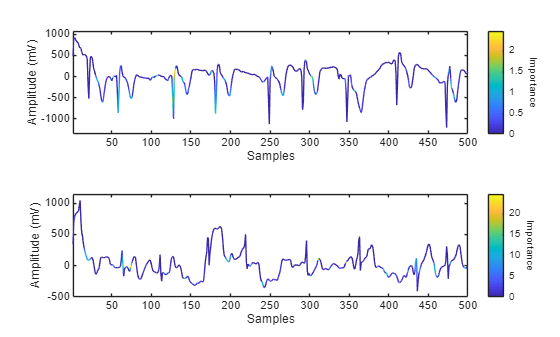
By analyzing Grad-CAM importance maps for misclassified signals, you can explore why the network might have made incorrect predictions. These visualizations can reveal if the model is focusing on irrelevant or ambiguous parts of the signal, or is missing key features in the signal. Understanding these failure cases provides valuable insight into the limitations of the model and can guide improvements to training data, model architecture, or post-processing. In clinical applications, this kind of interpretability helps reveal edge cases and supports safer deployment of automated ECG classification systems.
In the next step of the workflow, you build an interactive app that allows clinicians to analyze ECG predictions and their Grad-CAM explanations in a user-friendly interface.
Supporting Functions
function plotWithColorGradient(sequence,importance)

x = 1:size(sequence,2) + 1;
y = [sequence NaN];
c = [importance NaN];

patch(x,y,c,EdgeColor="interp");

cb = colorbar(gca);
cb.Label.String = "Importance";
cb.Label.Rotation = 270;

xlabel("Samples")
ylabel("Amplitude (mV)")

box on
xlim tight
ylim padded

end