imageLIME
Syntax
Description
uses the locally-interpretable model-agnostic explanation (LIME) technique to compute a map
of the importance of the features in the input image scoreMap
= imageLIME(net
,X
,label
)X
when the network
net
evaluates the class score for the class given by
label
. Use this function to explain classification decisions and
check that your network is focusing on the appropriate features of the image.
The LIME technique approximates the classification behavior of the
net
using a simpler, more interpretable model. By generating
synthetic data from input X
, classifying the synthetic data using
net
, and then using the results to fit a simple regression model, the
imageLIME
function determines the importance of each feature of
X
to the network's classification score for class given by
label
.
This function requires Statistics and Machine Learning Toolbox™.
[
also returns a map of the features used to compute the LIME results and the calculated
importance of each feature.scoreMap
,featureMap
,featureImportance
] = imageLIME(net
,X
,label
)
___ = imageLIME(___,
specifies options using one or more name-value pair arguments in addition to the input
arguments in previous syntaxes. For example, Name,Value
)'NumFeatures',100
sets the
target number of features to 100.
Examples
Visualize Which Parts of an Image are Important for Classification
Use imageLIME
to visualize the parts of an image are important to a network for a classification decision.
Import the pretrained network SqueezeNet.
net = squeezenet;
Import the image and resize to match the input size for the network.
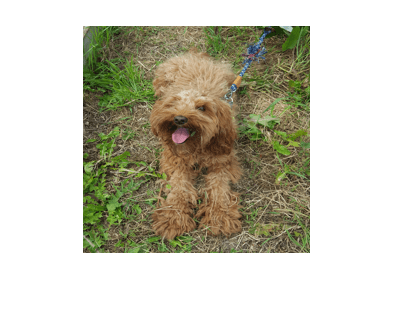
X = imread("laika_grass.jpg");
inputSize = net.Layers(1).InputSize(1:2);
X = imresize(X,inputSize);
Display the image. The image is of a dog named Laika.
imshow(X)
Classify the image to get the class label.
label = classify(net,X)
label = categorical
toy poodle
Use imageLIME
to determine which parts of the image are important to the classification result.
scoreMap = imageLIME(net,X,label);
Plot the result over the original image with transparency to see which areas of the image affect the classification score.
figure imshow(X) hold on imagesc(scoreMap,'AlphaData',0.5) colormap jet
The network focuses predominantly on Laika's head and back to make the classification decision. Laika's eye and ear are also important to the classification result.
Visualize Only the Most Important Features
Use imageLIME
to determine the most important features in an image and isolate them from the unimportant features.
Import the pretrained network SqueezeNet.
net = squeezenet;
Import the image and resize to match the input size for the network.
X = imread("sherlock.jpg");
inputSize = net.Layers(1).InputSize(1:2);
X = imresize(X,inputSize);
Classify the image to get the class label.
label = classify(net,X)
label = categorical
golden retriever
Compute the map of the feature importance and also obtain the map of the features and the feature importance. Set the image segmentation method to 'grid'
, the number of features to 64
, and the number of synthetic images to 3072
.
[scoreMap,featureMap,featureImportance] = imageLIME(net,X,label,'Segmentation','grid','NumFeatures',64,'NumSamples',3072);
Plot the result over the original image with transparency to see which areas of the image affect the classification score.
figure imshow(X) hold on imagesc(scoreMap,'AlphaData',0.5) colormap jet colorbar
Use the feature importance to find the indices of the most important five features.
numTopFeatures = 5; [~,idx] = maxk(featureImportance,numTopFeatures);
Use the map of the features to mask out the image so only the most important five features are visible. Display the masked image.
mask = ismember(featureMap,idx); maskedImg = uint8(mask).*X; figure imshow(maskedImg);
View Important Features Using Custom Segmentation Map
Use imageLIME
with a custom segmentation map to view the most important features for a classification decision.
Import the pretrained network GoogLeNet.
net = googlenet;
Import the image and resize to match the input size for the network.
X = imread("sherlock.jpg");
inputSize = net.Layers(1).InputSize(1:2);
X = imresize(X,inputSize);
Classify the image to get the class label.
label = classify(net,X)
label = categorical
golden retriever
Create a matrix defining a custom segmentation map which divides the image into triangular segments. Each triangular segment represents a feature.
Start by defining a matrix with size equal to the input size of the image.
segmentationMap = zeros(inputSize(1));
Next, create a smaller segmentation map which divides a 56-by-56 pixel region into two triangular features. Assign values 1 and 2 to the upper and lower segments, representing the first and second features, respectively.
blockSize = 56;
segmentationSubset = ones(blockSize);
segmentationSubset = tril(segmentationSubset) + segmentationSubset;
% Set the diagonal elements to alternate values 1 and 2.
segmentationSubset(1:(blockSize+1):end) = repmat([1 2],1,blockSize/2)';
To create a custom segmentation map for the whole image, repeat the small segmentation map. Each time you repeat the smaller map, increase the feature index values so that the pixels in each triangular segment correspond to a unique feature. In the final matrix, value 1 indicates the first feature, value 2 the second feature, and so on for each segment in the image.
blocksPerSide = inputSize(1)/blockSize; subset = 0; for i=1:blocksPerSide for j=1:blocksPerSide xidx = (blockSize*(i-1))+1:(blockSize*i); yidx = (blockSize*(j-1))+1:(blockSize*j); segmentationMap(xidx,yidx) = segmentationSubset + 2*subset; subset = subset + 1; end end
View the segmentation map. This map divides the image into 32 triangular regions.
figure imshow(X) hold on imagesc(segmentationMap,'AlphaData',0.8); title('Custom Segmentation Map') colormap gray
Use imageLIME
with the custom segmentation map to determine which parts of the image are most important to the classification result.
scoreMap = imageLIME(net,X,label, ... 'Segmentation',segmentationMap);
Plot the result of imageLIME
over the original image to see which areas of the image affect the classification score.
figure; imshow(X) hold on title('Image LIME (Golden Retriever)') colormap jet; imagesc(scoreMap, "AlphaData", 0.5);
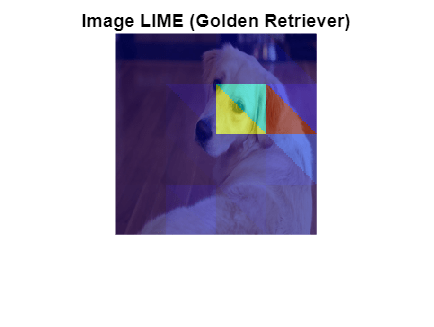
Red areas of the map have a higher importance — when these areas are removed, the score for the golden retriever class goes down. The most important feature for this classification is the ear.
Input Arguments
net
— Image classification network
SeriesNetwork
object | DAGNetwork
object
Image classification network, specified as a SeriesNetwork
object
or a DAGNetwork
object. You can get a trained network by importing a
pretrained network or by training your own network using the trainNetwork
function. For more information about pretrained networks, see
Pretrained Deep Neural Networks.
net
must contain a single input layer and a single output layer.
The input layer must be an imageInputLayer
. The output layer must be a classificationLayer
.
X
— Input image
numeric array
Input image, specified as a numeric array.
The image must be the same size as the image input size of the network
net
. The input size is specified by the
InputSize
property of the network's imageInputLayer
.
Data Types: single
| double
| int8
| int16
| int32
| int64
| uint8
| uint16
| uint32
| uint64
label
— Class label
categorical | char vector | string scalar | vector
Class label used to calculate the feature importance map, specified as a categorical, a char vector, a string scalar or a vector of these values.
If you specify label
as a vector, the software calculates the
feature importance for each class label independently. In that case,
scoreMap(:,:,k)
and featureImportance(idx,k)
correspond to the map of feature importance and the importance of feature
idx
for the k
th element in
label
, respectively.
Example: ["cat" "dog"]
Data Types: char
| string
| categorical
Name-Value Arguments
Specify optional pairs of arguments as
Name1=Value1,...,NameN=ValueN
, where Name
is
the argument name and Value
is the corresponding value.
Name-value arguments must appear after other arguments, but the order of the
pairs does not matter.
Before R2021a, use commas to separate each name and value, and enclose
Name
in quotes.
Example: 'NumFeatures',100,'Segmentation','grid',
'OutputUpsampling','bicubic','ExecutionEnvironment','gpu'
segments the input
image into a grid of approximately 100 features, executes the calculation on the GPU, and
upsamples the resulting map to the same size as the input image using bicubic interpolation.
NumFeatures
— Target number of features
49
(default) | positive integer
Target number of features to divide the input image into, specified as the
comma-separated pair consisting of 'NumFeatures'
and a positive
integer.
A larger value of 'NumFeatures'
divides the input image into
more, smaller features. To get the best results when using a larger number of
features, also increase the number of synthetic images using the
'NumSamples'
name-value pair.
The exact number of features depends on the input image and segmentation method
specified using the 'Segmentation'
name-value pair and can be
less than the target number of features.
When you specify
'Segmentation','superpixels'
, the actual number of features can be greater or less than the number specified using'NumFeatures'
.When you specify
'Segmentation','grid'
, the actual number of features can be less than the number specified using'NumFeatures'
. If your input image is square, specify'NumFeatures'
as a square number.When you specify
'Segmentation',segmentation
, wheresegmentation
is a two-dimensional matrix,'NumFeatures'
is the same as the number of unique elements in the matrix.
Example: 'NumFeatures',100
Data Types: single
| double
| int8
| int16
| int32
| int64
| uint8
| uint16
| uint32
| uint64
NumSamples
— Number of synthetic images
2048
(default) | positive integer
Number of synthetic images to generate, specified as the comma-separated pair
consisting of 'NumSamples'
and a positive integer.
A larger number of synthetic images gives better results but takes more time to compute.
Example: 'NumSamples',1024
Data Types: single
| double
| int8
| int16
| int32
| int64
| uint8
| uint16
| uint32
| uint64
Segmentation
— Segmentation method
'superpixels'
(default) | 'grid'
| numeric matrix
Segmentation method to use to divide the input image into features, specified as
the comma-separated pair consisting of 'Segmentation'
and
'superpixels'
, 'grid'
, or a two-dimensional
segmentation matrix.
The imageLIME
function segments the input image into features
in the following ways depending on the segmentation method.
'superpixels'
— Input image is divided into superpixel features, using thesuperpixels
(Image Processing Toolbox) function. Features are irregularly shaped, based on the value of the pixels. This option requires Image Processing Toolbox™.'grid'
— Input image is divided into a regular grid of features. Features are approximately square, based on the aspect ratio of the input image and the specified value of'NumFeatures'
. The number of grid cells can be smaller than the specified value of'NumFeatures'
. If the input image is square, specify'NumFeatures'
as a square number.numeric matrix — Input image is divided into custom features, using the numeric matrix as a map, where the integer value of each pixel specifies the feature of the corresponding pixel.
'NumFeatures'
is the same as the number of unique elements in the matrix. The size of the matrix must match the size of the input image.
For photographic image data, the 'superpixels'
option usually
gives better results. In this case, features are based on the contents of the image,
by segmenting the image into regions of similar pixel value. For other types of
images, such as spectrograms, the more regular 'grid'
option or a
custom segmentation map can provide more useful results.
Example: 'Segmentation','grid'
Model
— Type of simple model
'tree'
(default) | 'linear'
Type of simple model to fit, specified as the specified as the comma-separated
pair consisting of 'Model'
and 'tree'
or
'linear'
.
The imageLIME
function classifies the synthetic images using
the network net
and then uses the results to fit a simple,
interpretable model. The methods used to fit the results and determine the importance
of each feature depend on the type of simple model used.
'tree'
— Fit a regression tree usingfitrtree
(Statistics and Machine Learning Toolbox) then compute the importance of each feature usingpredictorImportance
(Statistics and Machine Learning Toolbox)'linear'
— Fit a linear model with lasso regression usingfitrlinear
(Statistics and Machine Learning Toolbox) then compute the importance of each feature using the weights of the linear model.
Example: 'Model','linear'
Data Types: char
| string
OutputUpsampling
— Output upsampling method
'nearest'
(default) | 'bicubic'
| 'none'
Output upsampling method to use when segmentation method is
'grid'
, specified as the comma-separated pair consisting of
'OutputUpsampling'
and one of the following.
'nearest'
— Use nearest-neighbor interpolation expand the map to the same size as the input data. The map indicates the size of the each feature with respect to the size of the input data.'bicubic'
— Use bicubic interpolation to produce a smooth map the same size as the input data.'none'
— Use no upsampling. The map can be smaller than the input data.
If 'OutputUpsampling'
is 'nearest'
or
'bicubic'
, the computed map is upsampled to the size of the input
data using the imresize
function.
Example: 'OutputUpsampling','bicubic'
MiniBatchSize
— Size of mini-batch
128 (default) | positive integer
Size of the mini-batch to use to compute the map feature importance, specified as
the comma-separated pair consisting of 'MiniBatchSize'
and a
positive integer.
A mini-batch is a subset of the set of synthetic images. The mini-batch size specifies the number of synthetic images that are passed to the network at once. Larger mini-batch sizes lead to faster computation, at the cost of more memory.
Example: 'MiniBatchSize',256
ExecutionEnvironment
— Hardware resource
'auto'
(default) | 'cpu'
| 'gpu'
Hardware resource for computing map, specified as the comma-separated pair
consisting of 'ExecutionEnvironment'
and one of the
following.
'auto'
— Use a GPU if one is available. Otherwise, use the CPU.'cpu'
— Use the CPU.'gpu'
— Use the GPU.
The GPU option requires Parallel Computing Toolbox™.
To use a GPU for deep
learning, you must also have a supported GPU device. For information on supported devices, see
GPU Computing Requirements (Parallel Computing Toolbox).
If you choose the 'ExecutionEnvironment','gpu'
option and
Parallel Computing Toolbox or a suitable GPU is not available, then the software returns an
error.
Example: 'ExecutionEnvironment','gpu'
Output Arguments
scoreMap
— Map of feature importance
numeric matrix | numeric array
Map of feature importance, returned as a numeric matrix or a numeric array. Areas in the map with higher positive values correspond to regions of input data that contribute positively to the specified classification label.
The value of scoreMap(i,j)
denotes the importance of the image
pixel (i,j)
to the simple model, except when you use the options
'Segmentation','grid'
, and
'OutputUpsampling','none'
. In that case, the
scoreMap
is smaller than the input image, and the value of
scoreMap(i,j)
denotes the importance of the feature at position
(i,j)
in the grid of features.
If label
is specified as a vector, the change in
classification score for each class label is calculated independently. In that case,
scoreMap(:,:,k)
corresponds to the occlusion map for the
k
th element in label
.
featureMap
— Map of features
numeric matrix
Map of features, returned as a numeric matrix.
For each pixel (i,j)
in the input image, idx =
featureMap(i,j)
is an integer corresponding to the index of the feature
containing that pixel.
featureImportance
— Feature importance
numeric vector | numeric matrix
Feature importance, returned as a numeric vector or a numeric matrix.
The value of featureImportance(idx)
is the calculated importance
of the feature specified by idx
. If you provide labels as a vector of
categorical values, char vectors, or string scalars, then
featureImportance(idx,k)
corresponds to the importance of feature
idx
for label(k)
.
More About
LIME
The locally interpretable model-agnostic explanations (LIME) technique is an explainability technique used to explain the classification decisions made by a deep neural network.
Given the classification decision of deep network for a piece of input data, the LIME technique calculates the importance of each feature of the input data to the classification result.
The LIME technique approximates the behavior of a deep neural network using a simpler,
more interpretable model, such as a regression tree. To map the importance of different
parts of the input image, the imageLIME
function of performs the
following steps.
Segment the image into features.
Generate synthetic image data by randomly including or excluding features. Each pixel in an excluded feature is replaced with the value of the average image pixel.
Classify the synthetic images using the deep network.
Fit a regression model using the presence or absence of image features for each synthetic image as binary regression predictors for the scores of the target class.
Compute the importance of each feature using the regression model.
The resulting map can be used to determine which features were most important to a particular classification decision. This can be especially useful for making sure your network is focusing on the appropriate features when classifying.
Version History
Introduced in R2020b
See Also
activations
| classify
| occlusionSensitivity
| gradCAM
Topics
- Understand Network Predictions Using LIME
- Investigate Spectrogram Classifications Using LIME
- Interpret Deep Network Predictions on Tabular Data Using LIME
- Understand Network Predictions Using Occlusion
- Grad-CAM Reveals the Why Behind Deep Learning Decisions
- Investigate Network Predictions Using Class Activation Mapping
MATLAB 命令
您点击的链接对应于以下 MATLAB 命令:
请在 MATLAB 命令行窗口中直接输入以执行命令。Web 浏览器不支持 MATLAB 命令。
Select a Web Site
Choose a web site to get translated content where available and see local events and offers. Based on your location, we recommend that you select: .
You can also select a web site from the following list:
How to Get Best Site Performance
Select the China site (in Chinese or English) for best site performance. Other MathWorks country sites are not optimized for visits from your location.
Americas
- América Latina (Español)
- Canada (English)
- United States (English)
Europe
- Belgium (English)
- Denmark (English)
- Deutschland (Deutsch)
- España (Español)
- Finland (English)
- France (Français)
- Ireland (English)
- Italia (Italiano)
- Luxembourg (English)
- Netherlands (English)
- Norway (English)
- Österreich (Deutsch)
- Portugal (English)
- Sweden (English)
- Switzerland
- United Kingdom (English)