使用单目相机和语义分割创建占据栅格
此示例说明如何使用语义分割和深度学习来估计一辆车周围的可用空间和创建占据栅格。然后,您将使用该占据栅格创建车辆代价地图,该代价地图可用于规划路径。
关于可用空间估计
自由空间估计用于识别自主车辆周围可以行驶而不会碰到任何障碍物的区域,这些障碍物包括行人、路沿和其他车辆等。车辆可以使用各种传感器来估计可用空间,如雷达、激光雷达或相机。此示例主要演示使用语义分割基于图像传感器估计可用空间。
在本示例中,您将学习如何:
使用语义图像分割来估计可用空间。
基于可用空间估计创建占据栅格。
在鸟瞰图上可视化占据栅格。
基于占据栅格创建车辆代价地图。
检查世界坐标系中的位置被占据还是自由的。
下载预训练网络
此示例使用预训练的语义分割网络,该网络可以将像素分为 11 个不同类,包括 Road、Pedestrian、Car 和 Sky。通过将分类为 Road 的图像像素定义为可用空间,可以估计图像中的可用空间。所有其他类都定义为非可用空间或障碍物。
训练该网络的完整过程如使用深度学习进行语义分割 (Computer Vision Toolbox) 示例中所示。下载预训练的网络。
% Download and load the pretrained network.
data = downloadPretrainedNetwork('vision/data','segnetVGG16CamVid');
net = data.net;
注意:数据的下载时间取决于您的 Internet 连接。下载完成之前,上面使用的命令会阻止 MATLAB®。您也可以使用 Web 浏览器先将数据集下载到本地磁盘。这种情况下,要使用从 Web 下载的文件,请将上面代码中的 pretrainedFolder 变量更改为下载文件所在的位置。
估计可用空间
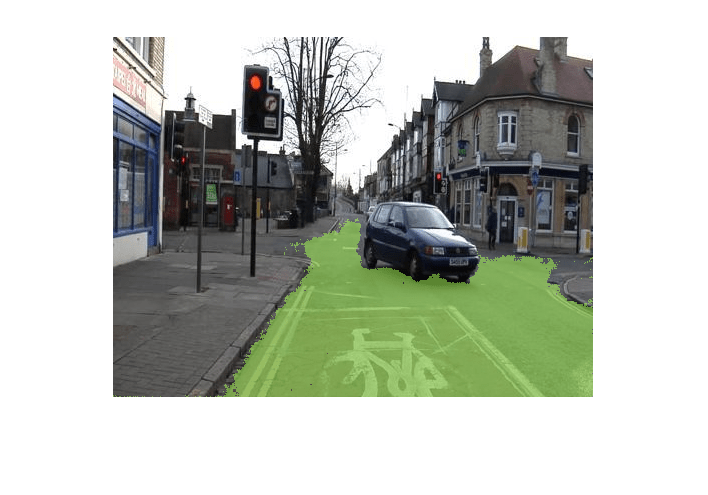
通过使用下载的语义分割网络处理图像来估计可用空间。网络返回图像中每个图像像素的分类。分类为 Road 的图像像素会被识别为可用空间。
本示例中使用的图像是 CamVid 数据集 [1] 中一个图像序列的单帧。本示例中所示的过程可应用于一系列帧,以估计车辆行驶时的可用空间。然而,由于本示例中使用了超深度卷积神经网络架构(具有 VGG-16 编码器的 SegNet),因此处理每帧大约需要 1 秒。因此,为了方便起见,此处仅处理单个帧。
% Read the image.
I = imread('seq05vd_snap_shot.jpg');

% Segment the image.
[C,scores,allScores] = semanticseg(I,net);

% Overlay free space onto the image.
B = labeloverlay(I,C,'IncludedLabels',"Road");

% Display free space and image.
figure
imshow(B)
要了解可用空间估计的置信度,请显示每个像素的 Road 类的输出分数。置信度值可用于向下游算法告知估计的有效性。例如,即使网络将某像素分类为 Road,出于安全原因,置信度分数也可能低到足以忽略该分类。
% Use the network's output score for Road as the free space confidence.
roadClassIdx = 4;
freeSpaceConfidence = allScores(:,:,roadClassIdx);

% Display the free space confidence.
figure
imagesc(freeSpaceConfidence)
title('Free Space Confidence Scores')
colorbar

虽然 Road 像素的初始分割结果显示道路上的大多数像素被正确分类,但对分数进行可视化后,可以了解分类器关于这些分类的置信度的更多细节。例如,当您靠近汽车的边界时,置信度会下降。
创建鸟瞰图图像
自由空间估计是在图像空间中生成的。为了便于生成适用于导航的占据栅格地图,需要将自由空间估计变换为车辆坐标系。这可以通过将自由空间估计变换为鸟瞰图来实现。
要创建鸟瞰图图像,首先定义相机传感器配置。本示例末尾列出的支持函数 camvidMonoCameraSensor 可返回 monoCamera (Automated Driving Toolbox) 对象,该对象表示用于收集 CamVid[1] 数据的单目相机。配置 monoCamera (Automated Driving Toolbox) 时需要相机的内参和外参,这些参数是使用 CamVid 数据集中提供的数据进行估计的。为了估计相机的内参,该函数使用了 CamVid 棋盘校准图像和 相机标定器 (Computer Vision Toolbox) App。相机外参估计(例如高度和俯仰角)来自于 CamVid 数据集的作者估计的外部参数数据。
% Create monoCamera for CamVid data.
sensor = camvidMonoCameraSensor();基于给定的相机设置,birdsEyeView (Automated Driving Toolbox) 对象将原始图像变换为鸟瞰图。此对象允许您指定要使用车辆坐标系变换的区域。请注意,车辆坐标单位是由 monoCamera (Automated Driving Toolbox) 对象根据相机台座高度单位确定的,本例中以米为单位。如果高度以毫米为单位指定,则仿真的其他部分也将使用毫米为单位。
% Define bird's-eye-view transformation parameters.
distAheadOfSensor = 20; % in meters, as previously specified in monoCamera height input
spaceToOneSide    = 3;  % look 3 meters to the right and left
bottomOffset      = 0;
outView = [bottomOffset, distAheadOfSensor, -spaceToOneSide, spaceToOneSide];

outImageSize = [NaN, 256]; % output image width in pixels; height is chosen automatically to preserve units per pixel ratio

birdsEyeConfig = birdsEyeView(sensor,outView,outImageSize);
为图像和自由空间置信度生成鸟瞰图。
% Resize image and free space estimate to size of CamVid sensor.
imageSize = sensor.Intrinsics.ImageSize;
I = imresize(I,imageSize);
freeSpaceConfidence = imresize(freeSpaceConfidence,imageSize);

% Transform image and free space confidence scores into bird's-eye view.
imageBEV = transformImage(birdsEyeConfig,I);
freeSpaceBEV = transformImage(birdsEyeConfig,freeSpaceConfidence);

% Display image frame in bird's-eye view.
figure
imshow(imageBEV)

将图像变换为鸟瞰图,并生成自由空间置信度。
figure
imagesc(freeSpaceBEV)
title('Free Space Confidence')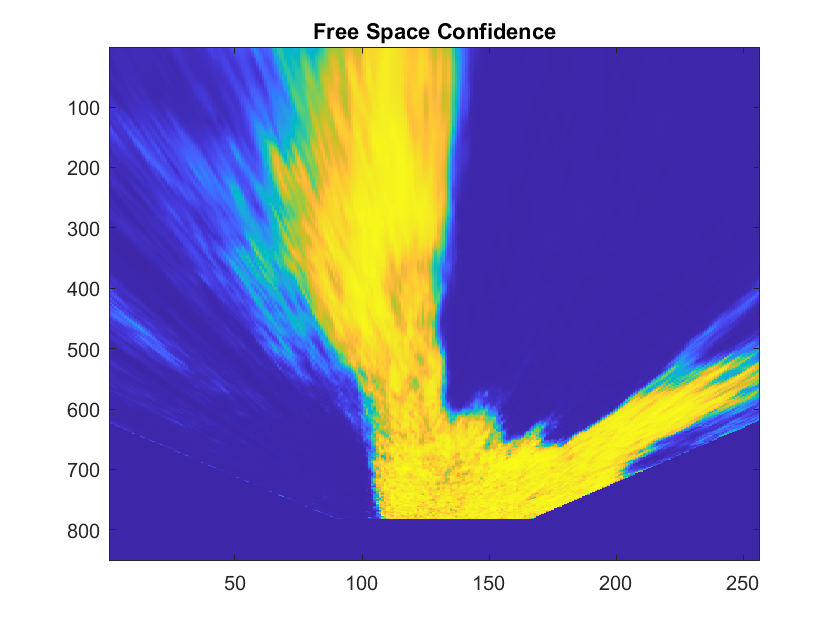
远离传感器的区域由于像素更少而更模糊,因此需要更多插值。
基于自由空间估计创建占据栅格图
占据栅格用于在车辆坐标系中将车辆的周围环境表示为离散网格,并用于路径规划。占据栅格中的每个单元都有一个代表该单元格占据概率的值。估计的自由空间可用于填充占据栅格的值。
使用自由空间估计值填充占据栅格的过程如下:
以车辆坐标系定义占据栅格的大小。
为每个栅格单元生成一组 (X,Y) 点。这些点使用车辆坐标系。
使用
vehicleToImage(Automated Driving Toolbox) 变换将点从车辆坐标空间 (X,Y) 变换为鸟瞰图图像坐标空间 (x,y)。使用
griddedInterpolant抽取 (x,y) 位置处的自由空间置信度值,通过插值法来插补不完全位于图像像素中心的自由空间置信度值。使用该栅格单元中所有 (x,y) 点的平均自由空间置信度值来填充占据栅格单元。
为简洁起见,上面所述过程使用支持函数 createOccupancyGridFromFreeSpaceEstimate 实现,该函数列在此示例的末尾。根据鸟瞰图配置定义占据栅格的大小,并通过调用 createOccupancyGridFromFreeSpaceEstimate 创建占据栅格。
% Define dimensions and resolution of the occupancy grid.
gridX = distAheadOfSensor;
gridY = 2 * spaceToOneSide;
cellSize = 0.25; % in meters to match units used by CamVid sensor

% Create the occupancy grid from the free space estimate.
occupancyGrid = createOccupancyGridFromFreeSpaceEstimate(...
    freeSpaceBEV, birdsEyeConfig, gridX, gridY, cellSize);
使用 birdsEyePlot (Automated Driving Toolbox) 可视化占据栅格。创建一个 birdsEyePlot (Automated Driving Toolbox),并使用 pcolor 在最上层添加占据栅格。
% Create bird's-eye plot.
bep = birdsEyePlot('XLimits',[0 distAheadOfSensor],'YLimits', [-5 5]);

% Add occupancy grid to bird's-eye plot.
hold on
[numCellsY,numCellsX] = size(occupancyGrid);
X = linspace(0, gridX, numCellsX);
Y = linspace(-gridY/2, gridY/2, numCellsY);
h = pcolor(X,Y,occupancyGrid);
title('Occupancy Grid (probability)')
colorbar
delete(legend)

% Make the occupancy grid visualization transparent and remove grid lines.
h.FaceAlpha = 0.5;
h.LineStyle = 'none';

鸟瞰图还可以显示来自多个传感器的数据。例如,使用 coverageAreaPlotter (Automated Driving Toolbox) 添加雷达覆盖区域。
% Add coverage area to plot.
caPlotter = coverageAreaPlotter(bep, 'DisplayName', 'Coverage Area');

% Update it with a field of view of 35 degrees and a range of 60 meters
mountPosition = [0 0];
range = 15;
orientation = 0;
fieldOfView = 35;
plotCoverageArea(caPlotter, mountPosition, range, orientation, fieldOfView);
hold off
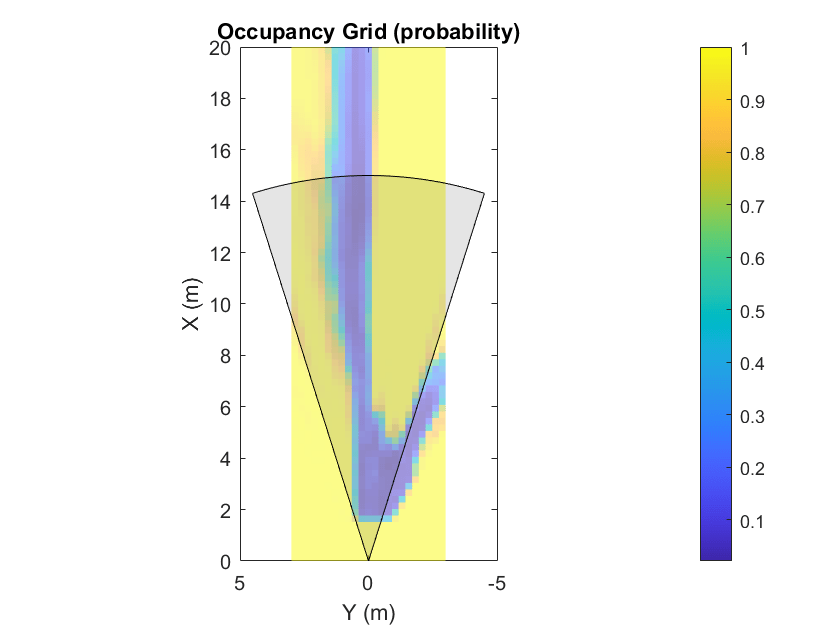
显示来自多个传感器的数据对于诊断和调试自动驾驶车辆作出的决策非常有用。
使用占据栅格创建车辆代价地图
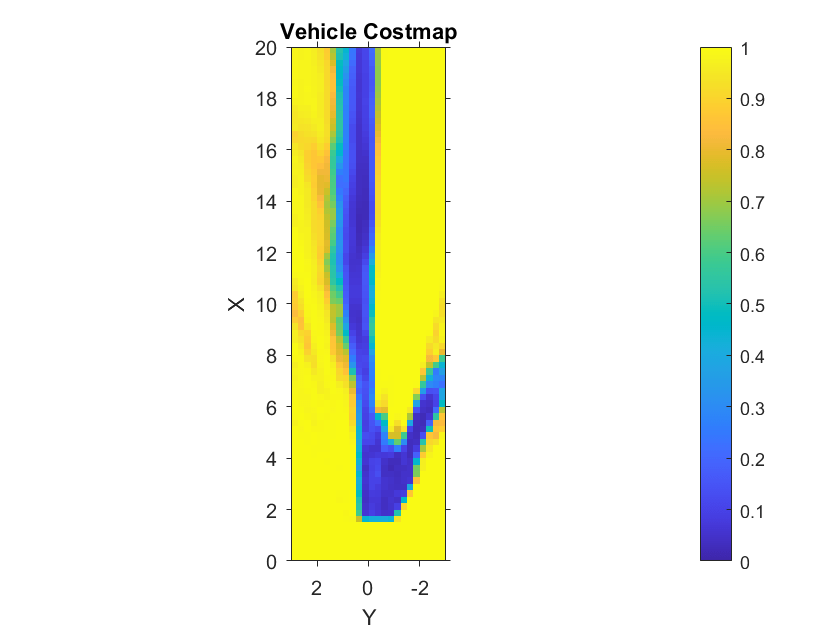
vehicleCostmap (Automated Driving Toolbox) 能够检查车辆或世界坐标系中的某位置是占据的还是自由的。这种检查对于任何路径规划或决策算法均为必需的。使用生成的 occupancyGrid 创建 vehicleCostmap (Automated Driving Toolbox)。
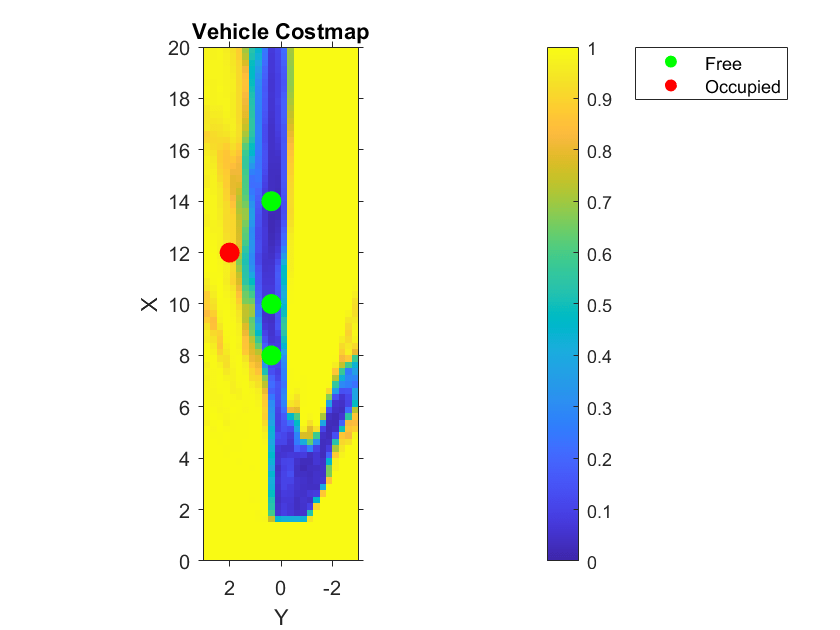
% Create the costmap.
costmap = vehicleCostmap(flipud(occupancyGrid), ...
    'CellSize',cellSize, ...
    'MapLocation',[0,-spaceToOneSide]);
costmap.CollisionChecker.InflationRadius = 0;

% Display the costmap.
figure
plot(costmap,'Inflation','off')
colormap(parula)
colorbar
title('Vehicle Costmap')

% Orient the costmap so that it lines up with the vehicle coordinate
% system, where the X-axis points in front of the ego vehicle and the
% Y-axis points to the left.
view(gca,-90,90)
为了说明如何使用 vehicleCostmap (Automated Driving Toolbox),使用世界坐标系创建一组位置。这些位置表示车辆可以通过的路径。
% Create a set of locations in vehicle coordinates.
candidateLocations = [
    8 0.375
    10 0.375
    12 2
    14 0.375
    ];
使用 checkOccupied (Automated Driving Toolbox) 检查每个位置是占据的还是自由的。根据结果,可能无法采用某条潜在的路径,因为它与 costmap 中定义的障碍物相冲突。
% Check if locations are occupied.
isOccupied = checkOccupied(costmap,candidateLocations);

% Partition locations into free and occupied for visualization purposes.
occupiedLocations = candidateLocations(isOccupied,:);
freeLocations = candidateLocations(~isOccupied,:);

% Display free and occupied points on top of costmap.
hold on
markerSize = 100;
scatter(freeLocations(:,1),freeLocations(:,2),markerSize,'g','filled')
scatter(occupiedLocations(:,1),occupiedLocations(:,2),markerSize,'r','filled');
legend(["Free" "Occupied"])
hold off
上面使用的 occupancyGrid、vehicleCostmap (Automated Driving Toolbox) 和 checkOccupied (Automated Driving Toolbox) 说明了 pathPlannerRRT (Automated Driving Toolbox) 等路径规划器使用的基本操作。您可以在Automated Parking Valet (Automated Driving Toolbox)示例中了解有关路径规划的详细信息。
参考资料
[1] Brostow, Gabriel J., Julien Fauqueur, and Roberto Cipolla."Semantic Object Classes in Video:A high-definition ground truth database."Pattern Recognition Letters.Vol. 30, Issue 2, 2009, pp. 88-97.
支持函数
function sensor = camvidMonoCameraSensor()
% Return a monoCamera camera configuration based on data from the CamVid
% data set[1].
%
% The cameraCalibrator app was used to calibrate the camera using the
% calibration images provided in CamVid:
%
% http://web4.cs.ucl.ac.uk/staff/g.brostow/MotionSegRecData/data/CalibrationSeq_and_Files_0010YU.zip
%
% Calibration pattern grid size is 28 mm.
%
% Camera pitch is computed from camera pose matrices [R t] stored here:
%
% http://web4.cs.ucl.ac.uk/staff/g.brostow/MotionSegRecData/data/EgoBoost_trax_matFiles.zip

% References
% ----------
% [1] Brostow, Gabriel J., Julien Fauqueur, and Roberto Cipolla. "Semantic Object
% Classes in Video: A high-definition ground truth database." _Pattern Recognition
% Letters_. Vol. 30, Issue 2, 2009, pp. 88-97.

calibrationData = load('camera_params_camvid.mat');

% Describe camera configuration.
focalLength    = calibrationData.cameraParams.FocalLength;
principalPoint = calibrationData.cameraParams.PrincipalPoint;
imageSize      = calibrationData.cameraParams.ImageSize;

% Camera height estimated based on camera setup pictured in [1].
height = 0.5;  % height in meters from the ground

% Camera pitch was computed using camera extrinsics provided in data set.
pitch = 0;  % pitch of the camera, towards the ground, in degrees

camIntrinsics = cameraIntrinsics(focalLength,principalPoint,imageSize);
sensor = monoCamera(camIntrinsics,height,'Pitch',pitch);
end
function occupancyGrid = createOccupancyGridFromFreeSpaceEstimate(...
    freeSpaceBEV,birdsEyeConfig,gridX,gridY,cellSize)
% Return an occupancy grid that contains the occupancy probability over
% a uniform 2-D grid.

% Number of cells in occupancy grid.
numCellsX = ceil(gridX / cellSize);
numCellsY = ceil(gridY / cellSize);

% Generate a set of (X,Y) points for each grid cell. These points are in
% the vehicle's coordinate system. Start by defining the edges of each grid
% cell.

% Define the edges of each grid cell in vehicle coordinates.
XEdges = linspace(0,gridX,numCellsX);
YEdges = linspace(-gridY/2,gridY/2,numCellsY);

% Next, specify the number of sample points to generate along each
% dimension within a grid cell. Use these to compute the step size in the
% X and Y direction. The step size will be used to shift the edge values of
% each grid to produce points that cover the entire area of a grid cell at
% the desired resolution.

% Sample 20 points from each grid cell. Sampling more points may produce
% smoother estimates at the cost of additional computation.
numSamplePoints = 20;

% Step size needed to sample number of desired points.
XStep = (XEdges(2)-XEdges(1)) / (numSamplePoints-1);
YStep = (YEdges(2)-YEdges(1)) / (numSamplePoints-1);

% Finally, slide the set of points across both dimensions of the grid
% cells. Sample the occupancy probability along the way using
% griddedInterpolant.

% Create griddedInterpolant for sampling occupancy probability. Use 1
% minus the free space confidence to represent the probability of occupancy.
occupancyProb = 1 - freeSpaceBEV;
sz = size(occupancyProb);
[y,x] = ndgrid(1:sz(1),1:sz(2));
F = griddedInterpolant(y,x,occupancyProb);

% Initialize the occupancy grid to zero.
occupancyGrid = zeros(numCellsY*numCellsX,1);

% Slide the set of points XEdges and YEdges across both dimensions of the
% grid cell.
for j = 1:numSamplePoints

    % Increment sample points in the X-direction
    X = XEdges + (j-1)*XStep;

    for i = 1:numSamplePoints

        % Increment sample points in the Y-direction
        Y = YEdges + (i-1)*YStep;

        % Generate a grid of sample points in bird's-eye-view vehicle coordinates
        [XGrid,YGrid] = meshgrid(X,Y);

        % Transform grid of sample points to image coordinates
        xy = vehicleToImage(birdsEyeConfig,[XGrid(:) YGrid(:)]);

        % Clip sample points to lie within image boundaries
        xy = max(xy,1);
        xq = min(xy(:,1),sz(2));
        yq = min(xy(:,2),sz(1));

        % Sample occupancy probabilities using griddedInterpolant and keep
        % a running sum.
        occupancyGrid = occupancyGrid + F(yq,xq);
    end

end

% Determine mean occupancy probability.
occupancyGrid = occupancyGrid / numSamplePoints^2;
occupancyGrid = reshape(occupancyGrid,numCellsY,numCellsX);
end