在 Simulink 中预测和更新网络状态
此示例说明如何在 Simulink® 中使用 Stateful Predict 模块预测经过训练的循环神经网络的响应。此示例使用预训练的长短期记忆 (LSTM) 网络。
加载预训练网络
按照 [1] 和 [2] 中的说明加载 JapaneseVowelsNet,这是一个基于日语元音数据集训练的预训练长短期记忆 (LSTM) 网络。此网络是基于按序列长度排序的序列训练的,小批量大小为 27。
load JapaneseVowelsNet
查看网络架构。
analyzeNetwork(net);
加载测试数据
加载日语元音测试数据。XTest 是包含 370 个不同长度的 12 维序列的元胞数组。TTest 是由对应于九个说话者的标签 "1"、"2"、..."9" 组成的分类向量。
创建一个时间表数组 simin,其中包含带有时间戳的行和 X 的重复副本。
load JapaneseVowelsTestData
X = XTest{94};
numTimeSteps = size(X,2);
simin = timetable(repmat(X,1,4)','TimeStep',seconds(0.2));
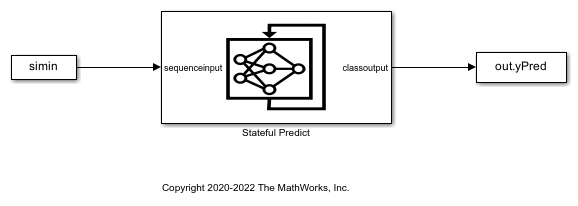
用于预测响应的 Simulink 模型
用于预测响应的 Simulink 模型包含一个 Stateful Predict 模块,用于预测分数;还包含一个 From Workspace 模块,用于加载各时间步的输入数据序列。
要在仿真期间将循环神经网络的状态重置为其初始状态,请将 Stateful Predict 模块放置在 Resettable Subsystem 内,并使用 Reset 控制信号作为触发器。
open_system('StatefulPredictExample');
配置模型进行仿真
设置 Stateful Predict 模块的模型配置参数。
set_param('StatefulPredictExample/Stateful Predict','NetworkFilePath','JapaneseVowelsNet.mat');
set_param('StatefulPredictExample', 'SimulationMode', 'Normal');
运行仿真
要计算 JapaneseVowelsNet 网络的响应,请运行仿真。预测分数保存在 MATLAB® 工作区中。
out = sim('StatefulPredictExample');
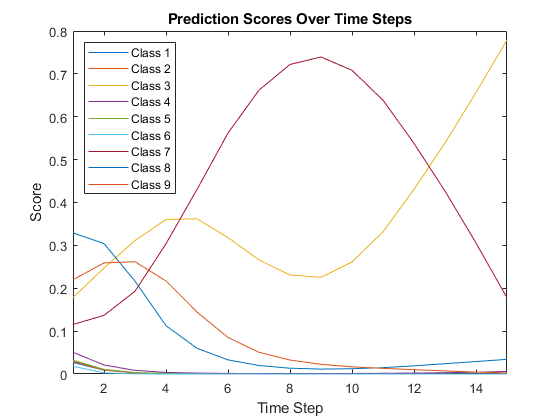
绘制预测分数。绘图显示了预测分数在不同时间步之间的变化情况。
scores = squeeze(out.yPred.Data(:,:,1:numTimeSteps));

classNames = string(net.Layers(end).Classes);
figure
lines = plot(scores');
xlim([1 numTimeSteps])
legend("Class " + classNames,'Location','northwest')
xlabel("Time Step")
ylabel("Score")
title("Prediction Scores Over Time Steps")
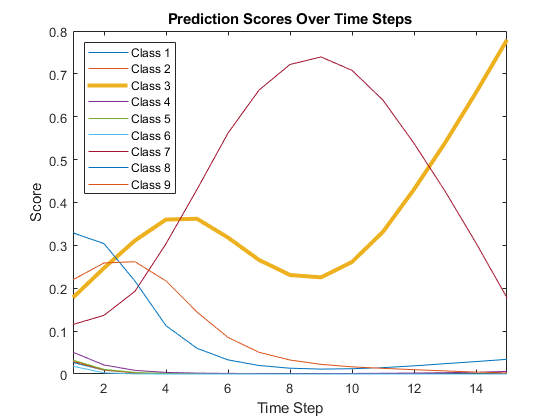
突出显示正确的类在各时间步的预测分数。
trueLabel = TTest(94);
lines(trueLabel).LineWidth = 3;
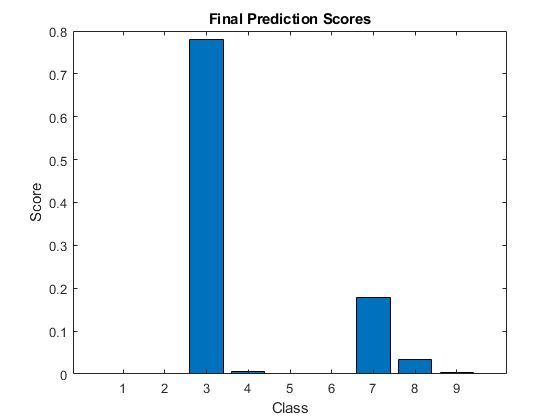
以条形图显示最终的时间步预测。
figure
bar(scores(:,end))
title("Final Prediction Scores")
xlabel("Class")
ylabel("Score")
参考
[1] M. Kudo, J. Toyama, and M. Shimbo. "Multidimensional Curve Classification Using Passing-Through Regions." Pattern Recognition Letters. Vol. 20, No. 11–13, pages 1103–1111.
[2] UCI Machine Learning Repository: Japanese Vowels Dataset. https://archive.ics.uci.edu/ml/datasets/Japanese+Vowels
另请参阅
Stateful Predict | Stateful Classify | Predict | Classify