ctrectmeas
Measurement function of constant turn-rate motion model for rectangular targets
Description
measurements = ctrectmeas(states,detections)gmphd object can use ctrectmeas as its
MeasurementFcn.
Examples
Load detections and truth generated from a rectangular target.
load('rectangularTargetDetections.mat','detections','truthState');
Generate expected detections from the target's rectangular state and actual detections using ctrectmeas.
tgtState = [3;48;0;60;0;5;1.9];
zExp = ctrectmeas(tgtState,detections);
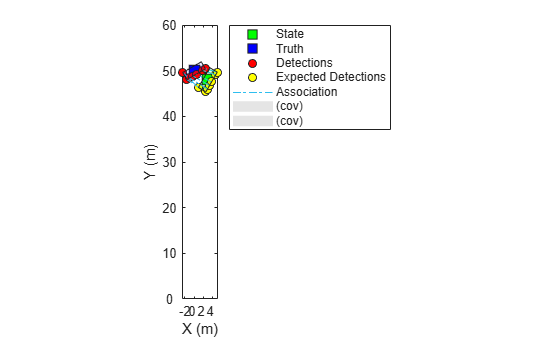
Set up visualization environment using theaterPlot.
theaterP = theaterPlot;
stateP = trackPlotter(theaterP,'DisplayName','State','MarkerFaceColor','g');
truthP = trackPlotter(theaterP,'DisplayName','Truth','MarkerFaceColor', 'b');
detP = detectionPlotter(theaterP,'DisplayName','Detections','MarkerFaceColor','r');
expDetP = detectionPlotter(theaterP,'DisplayName','Expected Detections','MarkerFaceColor','y');
l = legend(theaterP.Parent);
l.AutoUpdate = 'on';
hold on;
assignP = plot(theaterP.Parent,NaN,NaN,'-.','DisplayName','Association');
Plot actual and expected detections.
inDets = [detections{:}];
inMeas = horzcat(inDets.Measurement);
detP.plotDetection(inMeas');

zExpPlot = reshape(zExp,3,[]);
expDetP.plotDetection(zExpPlot');
Plot association lines.
zLines = nan(2,numel(detections)*3);
zLines(1,1:3:end) = zExpPlot(1,:);
zLines(2,1:3:end) = zExpPlot(2,:);
zLines(1,2:3:end) = inMeas(1,:);
zLines(2,2:3:end) = inMeas(2,:);
assignP.XData = zLines(1,:);
assignP.YData = zLines(2,:);
Plot truth and state.
truthPos = [truthState(1:2);0];
truthDims = struct('Length',truthState(6),...
    'Width',truthState(7),...
    'Height', 0,...
    'OriginOffset', [0 0 0]);
truthOrient = quaternion([truthState(4) 0 0],'eulerd', 'ZYX','frame');
truthP.plotTrack(truthPos',truthDims,truthOrient);

statePos = [tgtState(1:2);0];
stateDims = struct('Length',tgtState(6),...
    'Width',tgtState(7),...
    'Height',0,...
    'OriginOffset', [0 0 0]);
stateOrient = quaternion([tgtState(4) 0 0],'eulerd', 'ZYX','frame');
stateP.plotTrack(statePos', stateDims, stateOrient);
Input Arguments
Output Arguments
References
[1] Granström, Karl, et al. “Tracking Rectangular and Elliptical Extended Targets Using Laser Measurements.” 14th International Conference on Information Fusion, 2011, pp. 1–8. IEEE Xplore
Extended Capabilities
Version History
Introduced in R2019b
See Also
trackerPHD | gmphd | ctrect | ctrectmeasjac | ctrectjac | initctrectgmphd | ctrectcorners