trackingGlobeViewer
Description
Use the trackingGlobeViewer object to create a virtual globe for
tracking scenario visualization. Using the object, you can plot platforms, trajectories,
sensor coverages, detections, and tracks on the globe.
To display elements in a scenario on the virtual globe:
Create a
trackingGlobeViewerobject.Call its Object Functions to plot various elements in a tracking scenario.
Optionally, adjust the camera view using the pointer or the
camposandcamorientfunctions. You can also take a snapshot of the viewer using thesnapshotobject function.
Creation
Syntax
Description
viewer = trackingGlobeViewer
viewer = trackingGlobeViewer(EnableHomeButton="off")EnableHomeButton is "on", which
enables the Home button. (since R2026a)
viewer = trackingGlobeViewer(___,EnableBaseLayerPicker="off")EnableBaseLayerPicker is
"on", which enables the Base Layer Picker
button. (since R2026a)
viewer = trackingGlobeViewer(___,Name=Value)trackingGlobeViewer(CoverageMode="Beam") specifies the coverage
mode as "Beam".
Input Arguments
Properties
Reference frame location for non-Earth-centered components plotted in the viewer, specified as a three-element real-valued vector of the form [lat lon alt], where:
lat is the latitude in degrees.
lon is the longitude in degrees.
alt is the altitude above the WGS84 Earth model in meters.
You can only specify this property during object creation.
Example:
[10 10 5000]
Data Types: single | double
Display option for sensor coverages, specified as "Beam" or
"Coverage". When specified as
"Beam"— The viewer displays only the beam (field of view) of each sensor."Coverage"— The viewer displays both the beam and the coverage (field of regard) for each sensor.
Data Types: char | string
Covariance ellipse size in number of sigma, specified as a nonnegative integer. The
property determines the uncertainty level of the plotted covariance ellipse boundary.
For example, if you specify the property value as 3, then the
probability that the true state lies inside the covariance ellipse centered on the
plotted state is roughly 99.7%.
Set this property to 0 if you do not want to show covariance
ellipses.
Example:
3
Data Types: single | double
Length of the platform trajectory history line, specified as a nonnegative integer. The property determines the number of previous updates shown on the platform trajectory plot.
Example:
5
Data Types: single | double
Length of track history line, specified as a nonnegative integer. The property determines the number of previous updates shown on the track plot.
Example:
5
Data Types: single | double
Track label scaling factor, specified as a positive scalar. The property determines the size of the labels shown for each track on the plot.
Example:
1.5
Data Types: single | double
Visibility of dropped tracks on the globe, specified as true or
false. If a previously encountered
(TrackID,SourceIndex) pair is not found in the
current call to the plotTrack
function, the track is considered dropped.
Changing the value of this property only affects subsequent calls to the plotTrack
object function. To remove all graphics from the globe, use the clear
function.
Data Types: logical
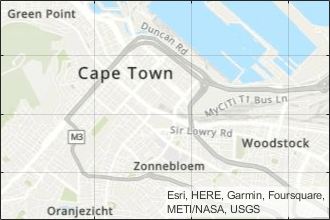
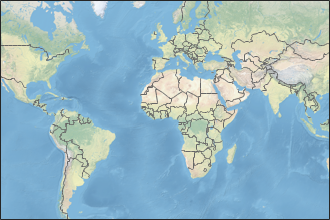
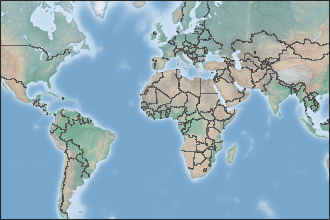
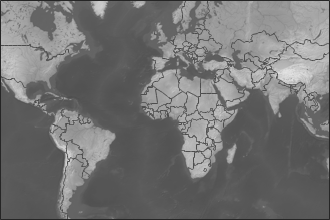
Map on which to plot data, specified as one of the values listed in the table. Six of the basemaps in the table are tiled data sets created using Natural Earth. Five of the basemaps are high-zoom-level maps hosted by Esri®.
|
|
Full global basemap composed of high-resolution satellite imagery. Hosted by Esri. |
|
General-purpose road map that emphasizes accurate, legible styling of roads and transit networks. Hosted by Esri. |
|
|
Map designed to provide geographic context while highlighting user data on a light background. Hosted by Esri. |
|
Map designed to provide geographic context while highlighting user data on a dark background. Hosted by Esri. |
|
|
General-purpose map with styling to depict topographic features. Hosted by Esri. |
|
Map that combines satellite-derived land cover data, shaded relief, and ocean-bottom relief. The light, natural palette is suitable for thematic and reference maps. Created using Natural Earth. |
|
|
Shaded relief map blended with a land cover palette. Humid lowlands are green and arid lowlands are brown. Created using Natural Earth. |
|
Terrain map in shades of gray. Shaded relief emphasizes both high mountains and micro-terrain found in lowlands. Created using Natural Earth. |
|
|
Two-tone, land-ocean map with light green land areas and light blue water areas. Created using Natural Earth. |
|
Two-tone, land-ocean map with gray land areas and white water areas. Created using Natural Earth. |
|
|
Two-tone, land-ocean map with light gray land areas and dark gray water areas. This basemap is installed with MATLAB®. Created using Natural Earth. |


All basemaps except "darkwater" require internet access. The
"darkwater" basemap is included with MATLAB and Sensor Fusion and Tracking Toolbox™.
If you do not have consistent access to the internet, you can download the basemaps created using Natural Earth onto your local system by using the Add-On Explorer.
The basemaps hosted by Esri update periodically. As a result, you might see differences in your visualizations over time.
Alignment of boundaries and region labels are a presentation of the feature provided by the data vendors and do not imply endorsement by MathWorks®.
You can also use the name of other basemap files, added by using theaddCustomBasemap function.
Example: g.Basemap = "bluegreen"
Data Types: char | string
Terrain of the globe, specified as a string scalar or a character vector. By default, you can use one of these two options:
"none"— The elevation of the terrain is 0 everywhere."gmted2010"— Global terrain derived form the Global Multi-resolution Terrain Elevation Data (USGS GMTED2010). This option requires internet access.
You can also use the name of other terrain files, added by using the
addCustomTerrain function.
You can only specify this property during object creation.
Data Types: char | string
Object Functions
plotScenario | Plot tracking scenario in trackingGlobeViewer |
plotPlatform | Plot platforms or targets in trackingGlobeViewer |
plotTrajectory | Plot trajectories in trackingGlobeViewer |
plotCoverage | Plot sensor coverage in trackingGlobeViewer |
plotDetection | Plot detections in trackingGlobeViewer |
plotTrack | Plot tracks in trackingGlobeViewer |
plotTrackLog | Plot log of tracks |
plotPlatformLog | Plot log of true platforms |
plotPlatformAssignment | Plot assignment between platforms and tracks |
clear | Clear plots in trackingGlobeViewer |
snapshot | Create snapshot of trackingGlobeViewer |
campos | Set or query camera position in trackingGlobeViewer |
camorient | Set or query camera orientation in
trackingGlobeViewer |
Examples
Create a default trackingGlobeViewer object.
viewer = trackingGlobeViewer
viewer =
  trackingGlobeViewer with properties:

                 Basemap: 'satellite'
       ReferenceLocation: [0 0 0]
    PlatformHistoryDepth: 1000
       TrackHistoryDepth: 1000
      NumCovarianceSigma: 2
      CoverageRangeScale: 1
         TrackLabelScale: 1
            CoverageMode: 'Beam'
       ShowDroppedTracks: 1
Create a geoTrajectory object to display on the viewer.
traj = geoTrajectory([0 0 100; 20 20 100],[0 3e4]);
Plot the trajectory on the virtual globe and change the camera position to see the trajectory.
plotTrajectory(viewer,traj,Color=[1 0 0])
campos(viewer,[5.7 3.5 1.7e7]);
Take a snapshot and show the figure.
drawnow
snapshot(viewer)
![]()
Load an air traffic control scenario into the workspace.
load("ATCScenario.mat")Create a tracking globe viewer and set its reference location.
refloc = [42.363 -71 0];
viewer = trackingGlobeViewer(ReferenceLocation=refloc);
Simulate the scenario and visualize it on the globe.
  while advance(scenario)
      detections = detect(scenario);
      plotScenario(viewer,scenario,detections);
  end
Show the final results in a snapshot.
snapshot(viewer)
![]()