plotPlatformAssignment
Syntax
Description
plotPlatformAssignment(
plots the assignment between tracks specified by viewer,trackIDs,platformIDs)trackIDs and platforms
specified by platformIDs on the tracking globe viewer. You must have
plotted the corresponding tracks and platforms on the globe viewer before using this
function.
Note
The source index of the plotted tracks must be 0 to use this
syntax. Otherwise, specify the source index using the next syntax.
plotPlatformAssignment(___,
specifies the source index for the tracks. The track ID combined with source index must
uniquely determine a track plotted on the globe viewer.sourceIndex)
plotPlatformAssignment(___,
specifies options using one or more name-value arguments. For example,
Name=Value)plotPlatformAssignment(viewer,trackIDs,platformIDs,LineWidth=2)
specifies the width of the assignment line as 2.
Examples
Create a tracking globe viewer and specify its base map, reference location, and camera position.
viewer = trackingGlobeViewer(Basemap ="darkwater",ReferenceLocation=[42, -71, 50]);
campos(viewer,[42, -71, 100]);
Plot a track at the position of [0,0,0] on the globe viewer.
trackID = 1;
plotTrack(viewer,objectTrack(TrackID=trackID,SourceIndex=0),"NED");
Plot a platform at the position of [2, 0, 0] on the globe viewer.
platformID = 2;
plotPlatform(viewer,struct(PlatformID=platformID,Position = [2 0 0]),"NED");
Assume the track is assigned with the platform. Plot the assignment.
plotPlatformAssignment(viewer,trackID,platformID);
Take a snapshot and show the results.
drawnow
snapshot(viewer)
![]()
Create a tracking globe viewer and specify its base map, reference location, and camera position.
viewer = trackingGlobeViewer(Basemap="darkwater",ReferenceLocation=[42 -71 50]);
campos(viewer,[42 -71 100]);
Create three tracks and three platforms. Specify their track IDs, track source IDs, and platform IDs. The first and second tracks have the same track ID but different source indices. The second and the third tracks have the same source index but different track IDs. Each track and platform has a different position.
trackIDs = [1 1 2];
sourceIDs = [1 3 3];
platformIDs = [2 3 4];
tracks = cell(1,3);
platforms = repmat(struct(PlatformID=0,Position=[0 0 0]),1,3);
for i = 1:3
    tracks{i} = objectTrack(TrackID=trackIDs(i),SourceIndex=sourceIDs(i), ...
        State=[i*5 zeros(1,5)]); % State in [x vx y vy z vz]
    platforms(i) = struct(PlatformID=platformIDs(i),Position=[i*4 1 0]); % Position in [x y z]
end
Plot the tracks and platforms assuming the north-east-down (NED) reference frame.
plotTrack(viewer,tracks,"NED");
plotPlatform(viewer,platforms,"NED",LineWidth=2);
Assume the first track is assigned with the first platform and plot the assignment.
plotPlatformAssignment(viewer,trackIDs(1),platformIDs(1),sourceIDs(1));
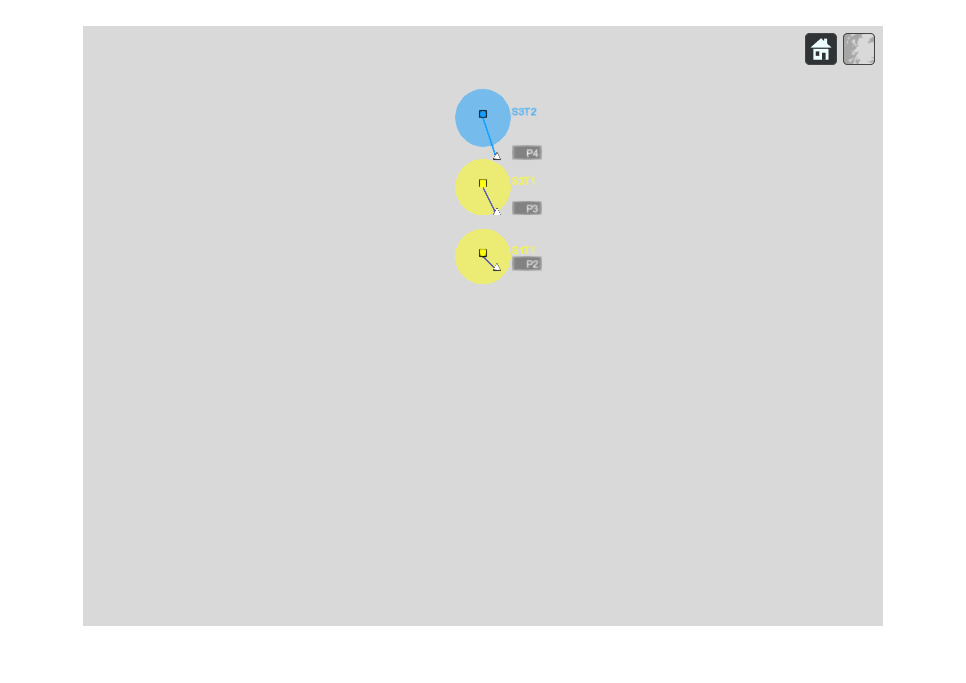
Assume the second and third tracks are assigned with second and third platforms, respectively. Plot the assignments.
plotPlatformAssignment(viewer,trackIDs(2:3),platformIDs(2:3),sourceIDs(2));
Take a snapshot and show the results.
drawnow
snapshot(viewer)
Input Arguments
Name-Value Arguments
Version History
Introduced in R2023bSee Also
trackAssignmentMetrics | currentAssignment | plotTrack | plotTrackLog | plotPlatform | plotPlatformLog
1 Alignment of boundaries and region labels are a presentation of the feature provided by the data vendors and do not imply endorsement by MathWorks®.