ChromaticAberrationChart
Description
Add-On Required: This feature requires the Optical Design and Simulation Library for Image Processing Toolbox add-on.
A ChromaticAberrationChart object stores information used to
display the lateral and longitudinal chromatic aberration of an optical system. You can change
aspects of the display, such as the title, line color, and legend, by modifying properties of
the ChromaticAberrationChart object.
Creation
Create a ChromaticAberrationChart object by using the show function
with a ChromaticAberration
object.
Properties
Chromatic aberration results, specified as a ChromaticAberration object.
Line color, specified as an RGB triplet, a hexadecimal color code, or a color name. You can also specify multiple colors as an M-by-3 numeric matrix where each row is an RGB triplet, or as an M-element string vector where each element is a hexadecimal color code or color name. If you specify a single color, the chart displays all results using the same color. If you specify multiple colors, then M must be equal to the number of wavelengths.
For a custom color, specify an RGB triplet or a hexadecimal color code.
An RGB triplet is a three-element row vector whose elements specify the intensities of the red, green, and blue components of the color. The intensities must be in the range
[0,1], for example,[0.4 0.6 0.7].A hexadecimal color code is a string scalar or character vector that starts with a hash symbol (
#) followed by three or six hexadecimal digits, which can range from0toF. The values are not case sensitive. Therefore, the color codes"#FF8800","#ff8800","#F80", and"#f80"are equivalent.
Alternatively, you can specify some common colors by name. This table lists the named color options, the equivalent RGB triplets, and the hexadecimal color codes.
| Color Name | Short Name | RGB Triplet | Hexadecimal Color Code | Appearance |
|---|---|---|---|---|
"red" | "r" | [1 0 0] | "#FF0000" |
|
"green" | "g" | [0 1 0] | "#00FF00" |
|
"blue" | "b" | [0 0 1] | "#0000FF" |
|
"cyan"
| "c" | [0 1 1] | "#00FFFF" |
|
"magenta" | "m" | [1 0 1] | "#FF00FF" |
|
"yellow" | "y" | [1 1 0] | "#FFFF00" |
|
"black" | "k" | [0 0 0] | "#000000" |
|
"white" | "w" | [1 1 1] | "#FFFFFF" |
|
Example: Color="r"
Example: Color="green"
Example: Color=[0 0.4470 0.7410]
Chart title, specified as a string scalar or character vector.
Data Types: char | string
Legend display, specified as "on" or "off", or
as numeric or logical 1 (true) or
0 (false). A value of "on"
is equivalent to true, and "off" is equivalent to
false. The value is stored as an on/off logical value of type
matlab.lang.OnOffSwitchState.
Grid lines to display, specified as one of these options.
"major"— The chart displays only major grid lines."minor"— The chart displays major and minor grid lines."off"— The chart does not display any grid lines.
Data Types: char | string
Parent UI container, specified as a Figure object,
Panel object, Tab object, or
TiledChartLayout object. By default, the function creates a new
Figure object. You can create these UI containers using their
respective creation functions.
UI Figure —
uifigureUI Panel —
uipanelUI Tab —
uitabUI Tiled Layout —
tiledlayout
Examples
Load a double Gauss lens from a ZMX file into the workspace.
opsys = zmximport("DoubleGaussLens.zmx");Internal error: ERROR: phRayTrace::TraceSequential()- Hit wrong side of surface
Trace the marginal rays and the chief ray for the optical system.
mrays = traceMarginalRays(opsys);
cray = traceChiefRay(opsys);
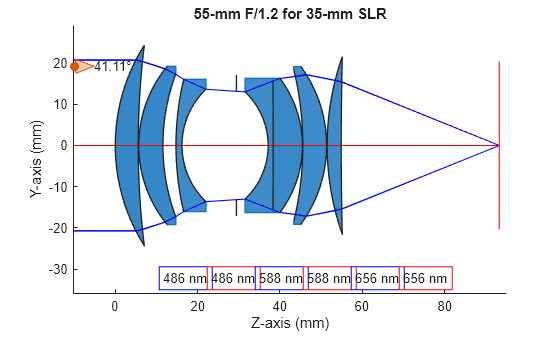
Display a 2-D visualization of the optical system and the traced rays. The displayed chief ray is red, and the marginal rays are blue.
hv = view2d(opsys);
addRays(hv,mrays,Color="b")
addRays(hv,cray,Color="r")
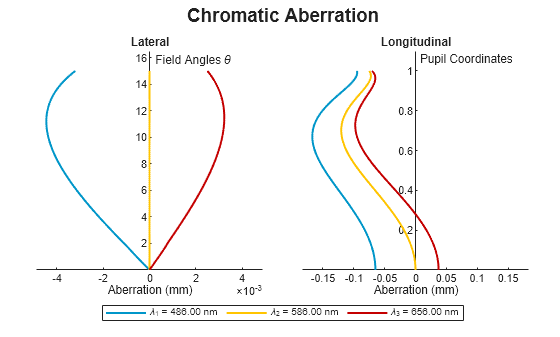
Compute the chromatic aberration of an optical system using the chromaticAberration object function. Specify the maximum field angle as 15 degrees using the MaxFieldAngle name-value argument. Display the results using the show object function.
ca = chromaticAberration(opsys,Wavelengths=[486 586 656],MaxFieldAngle=15);
show(ca)
ans =
  ChromaticAberrationChart with properties:

    ChromaticAberration: [1×1 optics.result.ChromaticAberration]
                  Color: [3×3 double]
                  Title: "Chromatic Aberration"
                 Legend: on
                   Grid: "off"
                 Parent: [1×1 Figure]

  Show all properties
Version History
Introduced in R2026a