主要内容

uiannotate

R2026b

Draw static ROIs in viewer window

Since R2026b

    Description

    The uiannotate function enables you to display one or more static ROI annotations in a Viewer object, which includes images displayed using the imageshow function and volumes displayed using volshow. For best performance, specify all the ROIs for your viewer together in a single function call. A single ROI object that contains all the static annotations renders more efficiently than separate objects. You can specify the initial appearance of the ROIs by using name-value arguments. After you create the ROIs, you can use the properties of the corresponding object to further customize the ROIs. To create interactive ROI annotations in a viewer, see uidraw.

    roi = uiannotate(viewer,shape,pos) creates a static ROI object that consists of one shape or multiple shapes of the same type, and draws the shapes in the Viewer object at the specified positions.

    example

    roi = uiannotate(viewer,shape,pos,Name=Value) modifies the appearance of the static ROI object using one or more name-value arguments. For example, you can specify the Color argument to assign colors to the shapes within the ROI.

    example

    Examples

    collapse all

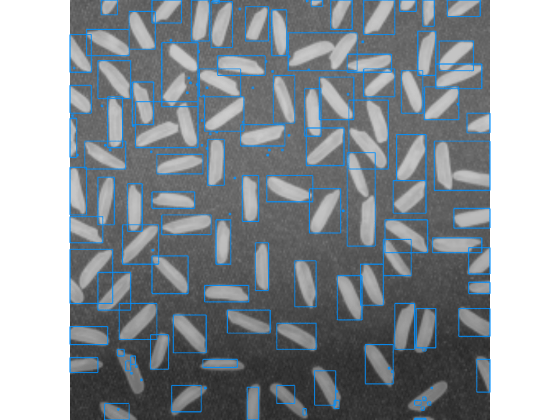
    Read a grayscale image of rice and binarize it to segment the rice grains from the background.

    I = imread("rice.png");
    bw = imbinarize(I);

    Extract bounding box position data for each detected region.

    props = regionprops(bw,"BoundingBox");
    position = vertcat(props.BoundingBox);

    Display the image using imageshow and overlay all bounding box annotations in a single uiannotate call. The function returns one Rectangles object, roi. When working with many annotations, displaying the annotations using one call improves performance compared to making separate calls for each shape.

    viewer = imageshow(I);
    roi = uiannotate(viewer,"rectangle",position);
    Read an image of nickels and dimes and use imfindcircles to detect the coins. The function returns the coin centers and radii.

    I = imread("coins.png");
    [centers,radii] = imfindcircles(I,[15 40],Sensitivity=0.9);

    Combine the centers and radii into one position variable in the format that the uiannotate function expects.

    circlePos = [centers radii];

    To assign each coin a different color, create an n-by-3 array of RGB values sampled from a colormap.

    colors = lines(numel(radii));

    Display the image using imageshow and overlay the detected circles in a single uiannotate call, specifying the Color name-value argument value as the RGB color array.

    viewer = imageshow(I);
    roi = uiannotate(viewer,"circle",circlePos,Color=colors);
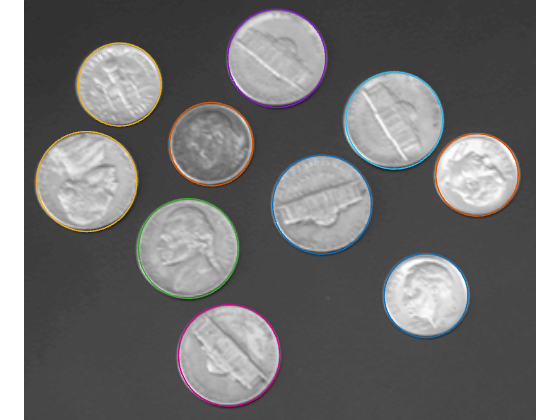
    Image of nickels and dimes against a dark background, with each coin outlined in a different color

    Optionally, you can update the appearance of the annotations by setting properties of the ROI object returned by uiannotate. The object properties enable more customization options, such as the opacity of the circle faces.

    roi.FaceAlpha = 0.3;
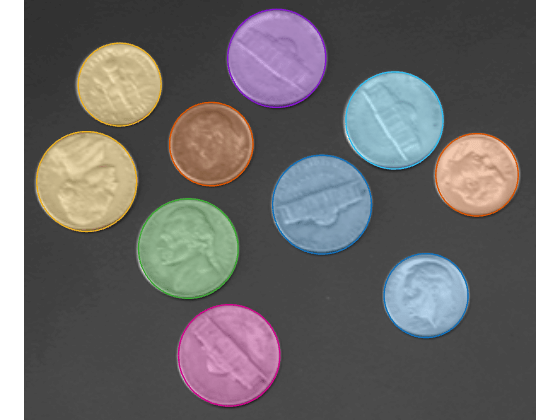
    Image of nickels and dimes against a dark background, with each coin outlined and shaded in a different color

    Read a grayscale image of household objects and threshold it to create a binary mask.

    RGB = imread("pillsetc.png");
    gray = im2gray(RGB);
    bw = imbinarize(gray);

    Get the boundary coordinates of the objects in the binary mask.

    B = bwboundaries(bw,"noholes");

    Define the object positions in the format the uiannotate function expects for freehand shapes. Concatenate the boundary cell arrays into a single matrix, inserting a [NaN NaN] row between each boundary to separate them. Flip columns from the [row col] format returned by bwboundaries to the [x y] format uiannotate expects.

    positionArray = [];
    for k = 1:numel(B)
        boundary = B{k};
        positionArray = [positionArray; boundary(:,[2 1]); NaN NaN];
    end

    Display the image using imageshow and overlay all boundaries in a single uiannotate call.

    viewer = imageshow(RGB);
    roi = uiannotate(viewer,"polyline",positionArray);
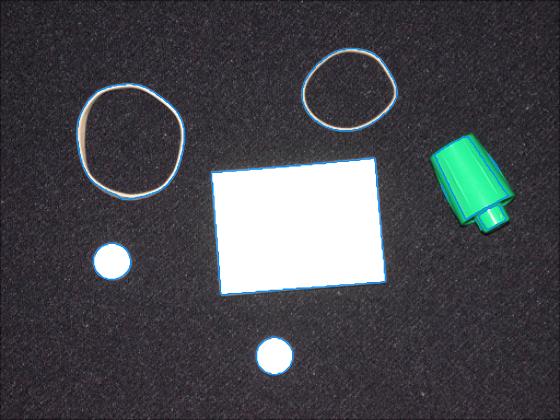
    Image of several irregularly shaped objects against a dark background, with each object outlined in blue

    Load a volume containing spheres of various sizes.

    load("spheresVol.mat")

    Binarize the volume and use regionprops3 to extract bounding boxes for each sphere.

    bw = imbinarize(V);
    stats = regionprops3(bw,"BoundingBox","EquivDiameter");
    bbox = stats.BoundingBox;

    Identify spheres with an equivalent diameter less than twenty pixels, and extract their bounding box coordinates.

    idx = find(stats.EquivDiameter < 20);
    position = bbox(idx,:);

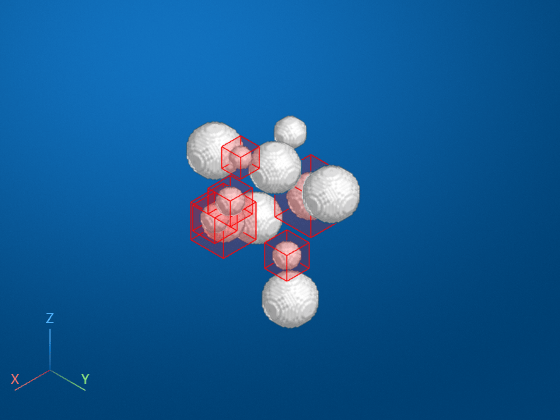
    Display the volume with volshow and overlay the bounding boxes for the small spheres as cuboid annotations using uiannotate.

    viewer = volshow(V);
    roi = uiannotate(viewer,"cuboid",position,Color="red");
    Input Arguments

    collapse all

    Viewer to draw the ROI in, specified as a Viewer object or a child of a Viewer object. For example, you can specify a Viewer object created using the viewer2d or viewer3d function. Examples of child objects of a viewer include the Image object returned by imageshow and the Volume object returned by volshow.

    This argument sets the Parent property of the output ROI object, and adds the ROI object to the Annotations property of the specified Viewer object. If you specify a child of a Viewer object, then the function adds the ROI object to the parent Viewer object itself.

    Shape of the ROI to draw, specified as one of the values in the table.

    ValueDescription
    "arrow" Create an Arrows object
    "circle" Create a Circles object
    "cuboid" Create a Cuboids object
    "cylinder"Create a Cylinders object
    "ellipse"Create an Ellipses object
    "ellipsoid"Create an Ellipsoids object
    "line"Create a Lines object
    "plus" Create a Plusses object
    "point" Create a Points object
    "polyline" Create a Polylines object
    "rectangle" Create a Rectangles object
    "sphere" Create a Spheres object

    Data Types: char | string

    Position for the ROI, specified as a numeric vector or numeric matrix. You can use the Position argument to specify multiple annotations of the same shape within a single ROI object.

    You can specify each position using one of the options listed in this table. For all positions, n is the number of shapes in the ROI. Values that omit z place the ROI in the default 2-D image plane, with z equal to 1.

    ShapePosition
    "arrow"

    For arrows defined by endpoints, specify an n-by-4 matrix or an n-by-6 matrix. Each row specifies an arrow in the form [x1 y1 x2 y2] or [x1 y1 z1 x2 y2 z2]. The tail of the arrow is at xy-coordinate (x1, y1) or xyz-coordinate (x1, y1, z1), respectively. The head of the arrow is at xy-coordinate (x2, y2) or xyz-coordinate (x2, y2, z2), respectively.

    For arrows defined by normal vectors and magnitudes, specify an n-by-5 matrix or an n-by-7 matrix. Each row specifies an arrow in the form [x y u v mag] or [x y z u v w mag]. The tail of the arrow is at xy-coordinate (x, y) or xyz-coordinate (x, y, z), respectively. The direction vector has x-, y-, and z-components u, v, and w, respectively. The magnitude of the arrow is mag.

    "cuboid"

    Axis-aligned cuboids:

    • Specify an n-by-6 matrix. Each row specifies a cuboid as a 6-element vector of the form [xmin ymin zmin width height depth]. The values of xmin, ymin, and zmin specify the minimum xyz-coordinates of the cuboid, while width, height, and depth specify the extent of the cuboid in the x-, y-, and z-dimensions, respectively.

    • Specify a vector of Cuboid spatial referencing objects.

    Rotated cuboids:

    • Specify an n-by-9 numeric matrix. Each row specifies a rotated cuboid as a 9-element vector of the form [xcen ycen zcen width height depth rotX rotY rotZ]. The values of xcen, ycen, and zcen specify the xyz-coordinates of the center of the cuboid, while width, height, and depth specify the extent of the cuboid in the x-, y-, and z-dimensions, respectively. The values of rotX, rotY, and rotZ specify the rotation angles, in degrees, about each axis. Each rotation is clockwise-positive with respect to the positive direction of the associated spatial axis. Rotation is applied assuming Euler angles in ZYX order.

    "cylinder"

    Specify an n-by-5 matrix or an n-by-8 matrix. Each row specifies a cylinder in the format [x y z r h] or [x y z r h rotX rotY rotZ]. The center of the cylinder is at xyz-coordinate (x, y, z). The cylinder has radius r and height h. If you include rotX, rotY, and rotZ, they specify the rotation angles in degrees about each axis. Each rotation is clockwise-positive with respect to the positive direction of the associated spatial axis. Rotation is applied assuming Euler angles in ZYX order.

    "ellipse"

    Specify an n-by-4 matrix or an n-by-5 matrix. Each row specifies an ellipse in the format [x y semix semiy] or [x y semix semiy theta]. The center of the ellipse is at xy-coordinate (x, y). The length of the semiaxes are semix and semiy. If you include theta, it specifies the rotation of the ellipse about the center of the ellipse, in degrees counterclockwise.

    "ellipsoid"

    Specify an n-by-6 matrix or an n-by-9 matrix. Each row specifies an ellipsoid in the format [x y z semix semiy semiz] or [x y z semix semiy semiz rotX rotY rotZ]. The center of the ellipsoid is at xyz-coordinate (x, y, z). The length of the semiaxes are semix, semiy, and semiz. If you include rotX, rotY, and rotZ, they specify the rotation angles in degrees about each axis. Each rotation is clockwise-positive with respect to the positive direction of the associated spatial axis. Rotation is applied assuming Euler angles in ZYX order.

    "line"

    Specify an n-by-4 or n-by-6 matrix. Each row specifies the endpoints of one line in the form [x1 y1 x2 y2] or [x1 y1 z1 x2 y2 z2].

    "plus"

    Specify an n-by-2 or n-by-3 matrix. Each row specifies the center coordinates of one plus shape in the form [x y] or [x y z].

    "point"

    Specify an n-by-2 or n-by-3 matrix. Each row specifies the coordinates of one point in the form [x y] or [x y z].

    "polyline"

    Specify an n-by-2 or n-by-3 matrix, where each row specifies a vertex or a polyline separator.

    • Vertices are in the form [x y] or [x y z] and specify the xy- or xyz-coordinates, respectively, of the point in the polyline shape.

    • Polyline separators delineate multiple polyline shapes within the ROI and have the form [NaN NaN] or [NaN NaN NaN].

    "rectangle"

    Axis-aligned rectangles:

    • Specify an n-by-4 numeric matrix. Each row specifies an axis-aligned rectangle as a 4-element vector of the form [xmin ymin width height]. The values of xmin and ymin specify the xy-coordinates of the upper-left corner of the rectangle, while width and height specify the extent of the rectangle in two dimensions.

    • Specify an n-element vector of Rectangle spatial referencing objects.

    Rotated rectangles:

    • Specify an n-by-5 numeric matrix. Each row specifies a rotated rectangle as a 5-element vector of the form [xcen ycen width height theta]. The values of xcen and ycen specify the xy-coordinates of the center of the rectangle, while width and height specify the extent of the rectangle in two dimensions. theta specifies the rotation of the rectangle about the center of the rectangle, in degrees counterclockwise.

    "sphere"

    Specify an n-by-4 numeric matrix. Each row specifies a sphere in the format [x y z r]. The center of the sphere is at xyz-coordinate (x, y, z). The sphere has radius r.

    Name-Value Arguments

    collapse all

    Specify optional pairs of arguments as Name1=Value1,...,NameN=ValueN, where Name is the argument name and Value is the corresponding value. Name-value arguments must appear after other arguments, but the order of the pairs does not matter.

    Example: uiannotate(viewer,"rectangle",[1 1 10 20; 4 18 10 20],Color="red") creates a Rectangles object consisting of two red rectangle shapes.

    ROI color, specified as an RGB triplet, a hexadecimal color code, a color name, or a short color name. If you specify multiple ROIs by using the Position argument, you can specify one color to apply to all of the ROIs, or separate colors for each ROI. Specify colors for n ROIs as an n-by-3 numeric matrix of RGB triplets.

    This table shows the default colors for static ROIs.

    RGB TripletAppearanceDefault Use
    [0 0.5610 1]

    A rectangle colored medium-light blue

    This is the default color when creating a static ROI in dark mode.
    [0.8660 0.3290 0]

    A rectangle colored orange

    This is the default color when creating a static ROI in light mode.

    For a custom color, specify an RGB triplet or a hexadecimal color code.

    • An RGB triplet is a three-element row vector whose elements specify the intensities of the red, green, and blue components of the color. The intensities must be in the range [0,1], for example, [0.4 0.6 0.7].

    • A hexadecimal color code is a string scalar or character vector that starts with a hash symbol (#) followed by three or six hexadecimal digits, which can range from 0 to F. The values are not case sensitive. Therefore, the color codes "#FF8800", "#ff8800", "#F80", and "#f80" are equivalent.

    Alternatively, you can specify some common colors by name. This table lists the named color options, the equivalent RGB triplets, and the hexadecimal color codes.

    Color NameShort NameRGB TripletHexadecimal Color CodeAppearance
    "red""r"[1 0 0]"#FF0000"

    Sample of the color red

    "green""g"[0 1 0]"#00FF00"

    Sample of the color green

    "blue""b"[0 0 1]"#0000FF"

    Sample of the color blue

    "cyan" "c"[0 1 1]"#00FFFF"

    Sample of the color cyan

    "magenta""m"[1 0 1]"#FF00FF"

    Sample of the color magenta

    "yellow""y"[1 1 0]"#FFFF00"

    Sample of the color yellow

    "black""k"[0 0 0]"#000000"

    Sample of the color black

    "white""w"[1 1 1]"#FFFFFF"

    Sample of the color white

    This table lists the default color palettes for plots in the light and dark themes.

    PalettePalette Colors

    "gem" — Light theme default

    Before R2025a: Most plots use these colors by default.

    Sample of the "gem" color palette

    "glow" — Dark theme default

    Sample of the "glow" color palette

    You can get the RGB triplets and hexadecimal color codes for these palettes using the orderedcolors and rgb2hex functions. For example, this code gets the RGB triplets for the "gem" palette and converts them to hexadecimal color codes.

    RGB = orderedcolors("gem");
    H = rgb2hex(RGB);

    Example: Color="r" specifies that all shapes of the ROI are colored red.

    Example: Color=[0 0.447 0.741] specifies that all shapes of the ROI have a custom color define by the RGB triplet [0 0.447 0.741].

    Example: Color=parula(5) specifies that each of five shapes within an ROI have a different color from the parula colormap.

    Opacity of the ROI, specified as a number in the range [0, 1]. When the value is 1, the ROI is completely opaque. When the value is 0, the ROI is completely transparent.

    ROI visibility, specified as "on" or "off", or as a numeric or logical 0 (false) or 1 (true). A value of "on" is equivalent to true, and "off" is equivalent to false. The value is stored as an on/off logical value of type OnOffSwitchState.

    ValueDescription
    "on"Display the ROI.
    "off"Hide the ROI without deleting it. You can still access the properties of an invisible ROI.

    Output Arguments

    collapse all

    ROI, returned as an ROI object of the type specified by shape. For example, if you specify shape as "circle", then the function creates a Circles object.

    Version History

    Introduced in R2026b









