Lines
R2026bDescription
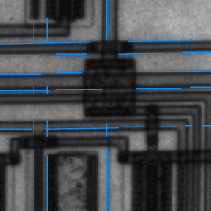
A Lines object labels one or more static lines in a
Viewer object. The properties of the object control the appearance and
behavior of the static line annotations.
Static ROIs provide high-performance annotations for images and
volumes you display in a Viewer object using imageshow and
volshow, respectively. Use static ROIs to draw large numbers of ROIs on
a viewer. For best performance, specify all the static ROIs together in a single function call
instead of creating multiple objects. Static ROIs are more efficient than customizable
viewer-based ROIs because they support fewer properties for styling, labeling, and interactions.
For a comparison of static viewer-based ROIs with other ROIs, see Choose Approach to Annotate ROIs in Images.
Creation
You can create a Lines object in these ways. For more information, see
Create Static Viewer-Based ROIs.
Use the
uiannotatefunction to create the ROI and display it in a specified viewer.Use the
images.ui.graphics.roi.static.Linesfunction described here. Display the ROI in a viewer by specifying theParentproperty value as the targetViewerobject during creation. Alternatively, display an ROI after you create it by adding the object to theAnnotationsproperty of aViewerobject.
Syntax
Description
l = images.ui.graphics.roi.static.Lines creates a
Lines object with default property values. Use
l to query and modify properties of the
Lines object after you create it.
l = images.ui.graphics.roi.static.Lines(
sets one or more properties using name-value arguments.PropertyName=Value)
Example:
l = images.ui.graphics.roi.static.Lines(Position=[10 15 10 20; 30 30 44
                  46])
creates a Lines object consisting of two
lines.
Properties
Shape and Position
Position of the ROI, specified as an n-by-4 or n-by-6 numeric matrix, where n is the number of lines in the ROI. Each row specifies the two endpoints of a line in one of these formats:
[x1 y1 x2 y2]— The line has endpoints at xy-coordinates (x1,y1) and (x2,y2). The object sets the z-coordinate of the endpoints to1.[x1 y1 z1 x2 y2 z2]— The line has endpoints at xyz-coordinates (x1,y1,z1) and (x2,y2,z2).
The Lines object stores the Position
property as an n-by-6 numeric matrix, where each row
represents a line with endpoints [x1 y1 z1 x2 y2 z2].
Geometric transformation that maps the intrinsic coordinate system to a world or map coordinate system, specified as one of the following.
2-D geometric transformation object:
affinetform2d,rigidtform2d,simtform2d, ortransltform2d3-D geometric transformation object:
affinetform3d,rigidtform3d,simtform3d,transltform3dMapping reference object:
MapCellsReference(Mapping Toolbox) orMapPostingsReference(Mapping Toolbox) (requires Mapping Toolbox™).Matrix of data type
doublerepresenting a 3-D affine geometric transformation. A valid 3-D affine transformation A has the form:
By default, Transformation is a 4-by-4 identity matrix.
Color and Styling
ROI color, specified as an RGB triplet, a hexadecimal color code, a color name, or a short color name. You can also specify multiple colors as an n-by-3 numeric matrix where each row is an RGB triplet. If you specify a single color, then all shapes in the ROI display with the same color. If you specify multiple colors, then n must be equal to the number of shapes in the ROI.
This table shows the default colors for static ROIs.
| RGB Triplet | Appearance | Default Use |
|---|---|---|
[0 0.5610 1] |
| This is the default color when creating a static ROI in dark mode. |
[0.8660 0.3290 0] |
| This is the default color when creating a static ROI in light mode. |


For a custom color, specify an RGB triplet or a hexadecimal color code.
An RGB triplet is a three-element row vector whose elements specify the intensities of the red, green, and blue components of the color. The intensities must be in the range
[0,1], for example,[0.4 0.6 0.7].A hexadecimal color code is a string scalar or character vector that starts with a hash symbol (
#) followed by three or six hexadecimal digits, which can range from0toF. The values are not case sensitive. Therefore, the color codes"#FF8800","#ff8800","#F80", and"#f80"are equivalent.
Alternatively, you can specify some common colors by name. This table lists the named color options, the equivalent RGB triplets, and the hexadecimal color codes.
| Color Name | Short Name | RGB Triplet | Hexadecimal Color Code | Appearance |
|---|---|---|---|---|
"red" | "r" | [1 0 0] | "#FF0000" |
|
"green" | "g" | [0 1 0] | "#00FF00" |
|
"blue" | "b" | [0 0 1] | "#0000FF" |
|
"cyan"
| "c" | [0 1 1] | "#00FFFF" |
|
"magenta" | "m" | [1 0 1] | "#FF00FF" |
|
"yellow" | "y" | [1 1 0] | "#FFFF00" |
|
"black" | "k" | [0 0 0] | "#000000" |
|
"white" | "w" | [1 1 1] | "#FFFFFF" |
|








This table lists the default color palettes for plots in the light and dark themes.
| Palette | Palette Colors |
|---|---|
Before R2025a: Most plots use these colors by default. |
|
|
|


You can get the RGB triplets and hexadecimal color codes for these palettes using the
orderedcolors and rgb2hex
functions. For example, get the RGB triplets for the "gem" palette
and convert them to hexadecimal color
codes.
RGB = orderedcolors("gem");
H = rgb2hex(RGB);
Example: Color="r" specifies that all shapes of the ROI are colored
red.
Example: Color=[0 0.447 0.741] specifies that all shapes of the ROI
have a custom color define by the RGB triplet [0 0.447
0.741].
Example: Color=parula(5) specifies that each of five shapes within
an ROI have a different color from the parula colormap.
Opacity of the ROI, specified as a number in the range [0, 1]. When the value is
1, the ROI is completely opaque. When the value is
0, the ROI is completely transparent.
ROI visibility, specified as "on" or "off", or as
. A value of "on" is equivalent to
true, and "off" is equivalent to
false. The value is stored as an on/off logical value of type
OnOffSwitchState.
| Value | Description |
|---|---|
"on" | Display the ROI. |
"off" | Hide the ROI without deleting it. You can still access the properties of an invisible ROI. |
Identifiers
Tag to associate with the ROI, specified as a character vector or string scalar. This property has no effect on the display, and the viewer does not use this property. You can use this property to track annotations for app building.
Data to associate with the ROI, specified as any MATLAB data. For example, you can specify a scalar, vector, matrix, cell array, string, character array, table, or structure. This property has no effect on the display, and the viewer does not use this property. You can use this property to append metadata to the ROI for app building.
Object Functions
createMask | Create binary mask image from ROI |
Examples
Display an image in a Viewer object. The viewer is the parent of the object returned by imageshow.
img = imageshow("circuit.tif");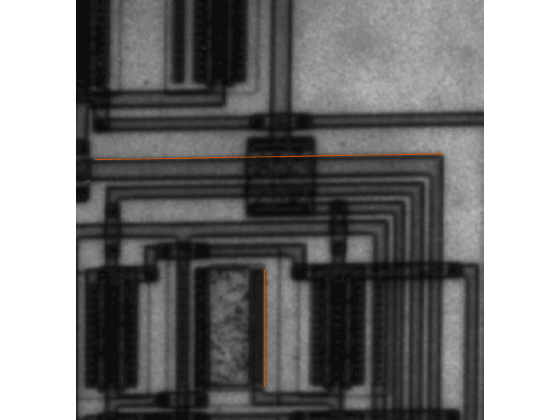
viewer = img.Parent;
Create a Lines object and display it in the viewer, using the Position property to specify two lines in the form [x1 y1 x2 y2]. A single object that contains all the annotations renders more efficiently than separate objects.
pos = [13 107 244 103;
    126 180 126 258];
l = images.ui.graphics.roi.static.Lines(Position=pos,Parent=viewer);
Version History
Introduced in R2026b

